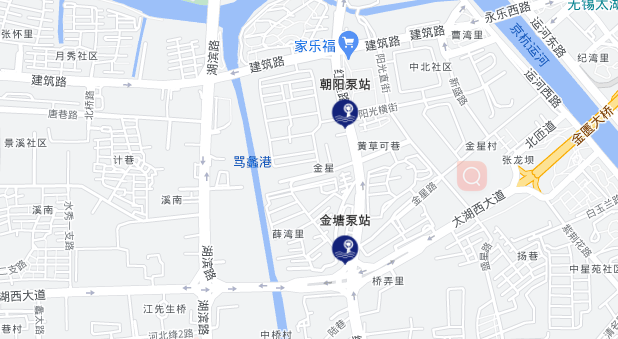
实现效果
代码如下
const setPoint = () => {
  const data = [
    {
      id: 11,
      poi: [120.28985, 31.54225],
      name: '金塘泵站'
    },
    {
      id: 22,
      poi: [120.28985, 31.54725],
      name: '朝阳泵站'
    }
  ]
  const pointGraphic: any[] = []
  data.forEach((d) => {
    const [long, lat] = d.poi
    const point = new Graphic({
      attributes: {
        ...d,
        pop: '4000',
        id: 'point.' + d.id
      },
      geometry: new Point({
        longitude: long,
        latitude: lat
      })
    })

    pointGraphic.push(point)
  })

  const symbol = {
    type: 'picture-marker',
    url: PointSewageImg,
    width: '30px',
    height: '30px',
    xoffset: '0px',
    yoffset: '15px'
  }

  const fields: any[] = [
    {
      name: 'ObjectID',
      alias: 'ObjectID',
      type: 'oid'
    }
  ]

  for (const col in pointGraphic[0]['attributes']) {
    fields.push({
      name: col,
      alias: col,
      type: 'string'
    })
  }

  // 标注
  const nameClass0: any = {
    symbol: {
      type: 'text', // autocasts as new TextSymbol()
      color: 'black',
      haloColor: 'white',
      haloSize: 1,
      // backgroundColor: [213, 184, 255, 0.75],
      // borderLineColor: 'green',
      // borderLineSize: 1,
      // yoffset: '2px',
      font: {
        //autocasts as new Font()
        size: 10
      }
    },
    labelPlacement: 'above-center',
    labelExpressionInfo: {
      expression: '$feature.name'
    }
  }

  const pointLayer = new FeatureLayer({
    source: pointGraphic,
    renderer: {
      type: 'class-breaks',
      field: 'pop',
      classBreakInfos: [
        {
          minValue: 4000,
          maxValue: 7000,
          symbol: symbol
        }
      ]
    } as any,
    geometryType: 'point',
    fields: fields,
    outFields: ['*'],
    objectIdField: 'ObjectID',
    labelingInfo: [nameClass0]
  })
  mapView.map.add(pointLayer)
}

 浙公网安备 33010602011771号