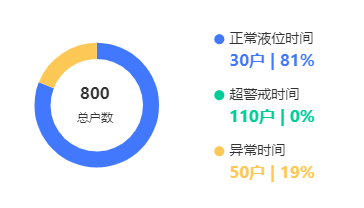
echarts饼图实现圆环图例修改
实现效果:

代码:
const option = {
  // 环形图中间文字
  title: {
    text: '1200',
    subtext: '总户数',
    textStyle: {
      fontSize: 16,
      color: '#333',
      fontWeight: 600,
    },
    subtextStyle: {
      fontSize: 12,
      color: '#333',
      fontWeight: 400,
    },
    textAlign: 'center', // 图例文字居中显示
    x: '23%', // 距离左边的距离
    y: '37%', // 距离上边的距离
  },
  legend: {
    orient: 'vertical',
    right: '10%',
    // top: 'center',
    top: '8%',
    icon: 'circle',
    // itemGap: 15, // 图例间距
    itemWidth: 10,
    data: ['正常液位时间', '超警戒时间', '异常时间'],
    textStyle: {
      fontSize: 14,
      color: '#333',
      lineHeight: 30,
      rich: {
        a: {
          color: '#4178fd',
          fontSize: 16,
          fontWeight: 600,
          lineHeight: 0, // 这里是实现图例小圆点对齐上方一行的关键
          padding: [16, 0, 0, 0], // 设置和上一行之间的间距 [上 右 下 左]
        },
        b: {
          color: '#00ce98',
          fontSize: 16,
          fontWeight: 600,
          lineHeight: 0,
          padding: [16, 0, 0, 0],
        },
        c: {
          color: '#fec856',
          fontSize: 16,
          fontWeight: 600,
          lineHeight: 0,
          padding: [16, 0, 0, 0],
        },
      },
    },
    formatter: (name) => {
      let data: string = '';

      if (name === '正常液位时间') {
        data = (Number(res.data[`${key}safe`]) * 100).toFixed();
        const text = `30户 | ${data}%`;
        return `${name}\n{a|${text}}`;
      }
      if (name === '超警戒时间') {
        data = (Number(res.data[`${key}warn`]) * 100).toFixed();
        const text = `110户 | ${data}%`;
        return `${name}\n{b|${text}}`;
      }
      if (name === '异常时间') {
        data = (Number(res.data[`${key}unknown`]) * 100).toFixed();
        const text = `50户 | ${data}%`;
        return `${name}\n{c|${text}}`;
      }
    },
  },
  series: [
    {
      name: '时间占比',
      type: 'pie',
      radius: ['43%', '58%'],
      center: ['25%', '48%'], // 左边的距离,上边的距离
      color: ['#4178fd', '#00ce98', '#fec856'],
      data: [
        {
          value: Number(res.data[key + 'safe']),
          name: '正常液位时间',
          label: {
            show: false,
          },
        },
        {
          value: Number(res.data[key + 'warn']),
          name: '超警戒时间',
          label: {
            show: false,
          },
        },
        {
          value: Number(res.data[key + 'unknown']),
          name: '异常时间',
          label: {
            show: false,
          },
        },
      ],
      emphasis: {
        itemStyle: {
          shadowBlur: 10,
          shadowOffsetX: 0,
          shadowColor: 'rgba(0, 0, 0, 0.5)',
        },
      },
    },
  ],
};


