from sklearn .linear_model import LinearRegression
LineR=LinearRegression()
LineR.fit(x.reshape(-1,1),y)
w=LineR.coef_
b=LineR.intercept_
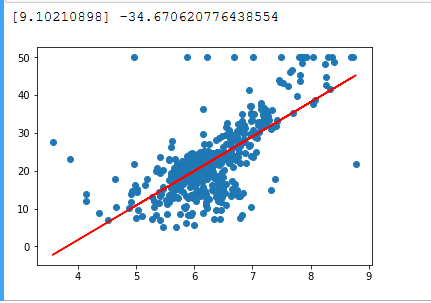
print(w,b)
import matplotlib.pyplot as plt
plt.scatter(x,y)
plt.plot(x,w*x+b,'r')
plt.show()
data=boston.data
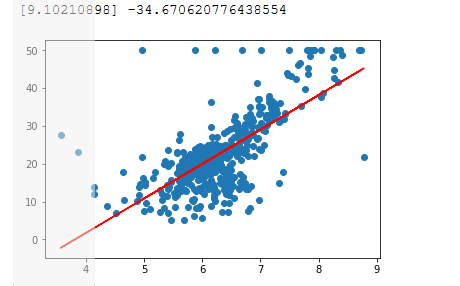
x=data[:,5]
y=boston.target
import matplotlib.pyplot as plt
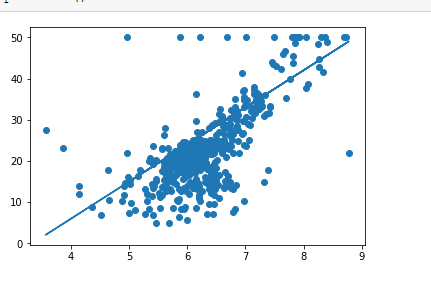
plt.scatter(x,y)
plt.plot(x,w*x+b)
plt.show()
from sklearn.linear_model import LinearRegression
LineR=LinearRegression()
LineR.fit(x.reshape(-1,1),y)
w=LineR.coef_
b=LineR.intercept_
import matplotlib.pyplot as plt
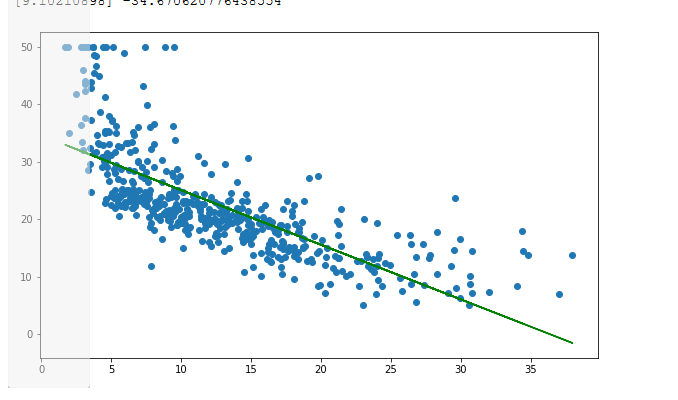
x=boston.data[:,12].reshape(-1,1)
y=boston.target
plt.figure(figsize=(10,6))
plt.scatter(x,y)
from sklearn.linear_model import LinearRegression
lineR=LinearRegression()
lineR.fit(x,y)
y_pred=lineR.predict(x)
plt.plot(x,y_pred,'green')
print(w,b)
plt.show()
from sklearn.linear_model import LinearRegression
LineR=LinearRegression()
LineR.fit(x.reshape(-1,1),y)
w=LineR.coef_
b=LineR.intercept_
print(w,b)
import matplotlib.pyplot as plt
plt.scatter(x,y)
plt.plot(x,w*x+b,'r')
plt.show()
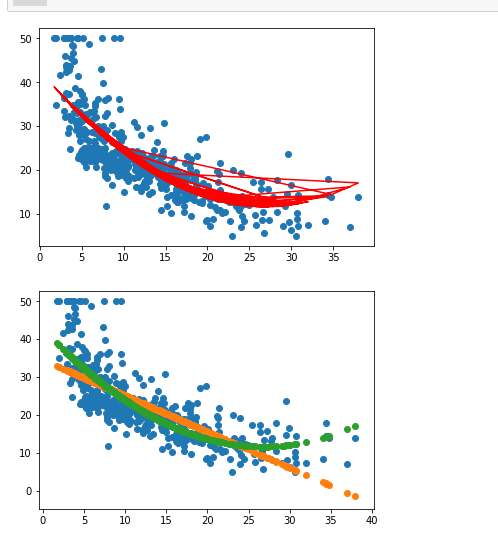
from sklearn.preprocessing import PolynomialFeatures
poly=PolynomialFeatures(degree=2)
x_poly=poly.fit_transform(x)

lrp=LinearRegression()
lrp.fit(x_poly,y)
y_ploy_pred=lrp.predict(x_poly)

plt.scatter(x,y)
plt.plot(x,y_ploy_pred,'r')
plt.show()

from sklearn.preprocessing import PolynomialFeatures
poly=PolynomialFeatures(degree=2)
x_poly=poly.fit_transform(x)
lrp=LinearRegression()
lrp.fit(x_poly,y)
plt.scatter(x,y)
plt.scatter(x,y_pred)
plt.scatter(x,y_ploy_pred)
plt.show()


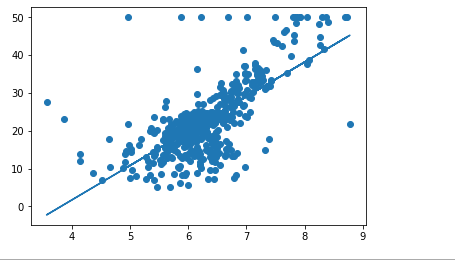
print(boston.DESCR)
data=boston.data x=data[:,5] y=boston.target import matplotlib.pyplot as plt plt.scatter(x,y) plt.plot(x,9*x-30) plt.show()