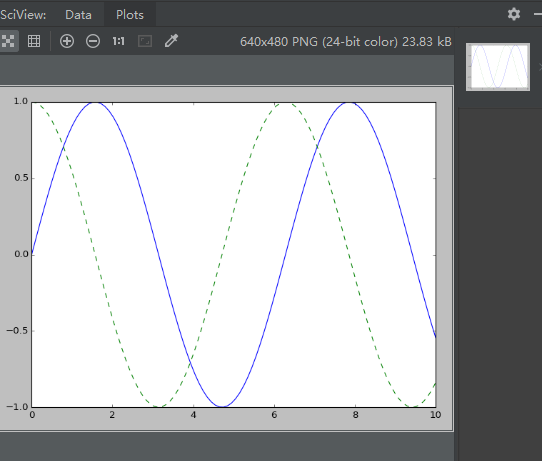
 1 import matplotlib as mpl
 2 import matplotlib.pyplot as plt
 3 import numpy as np
 4 import warnings
 5 warnings.filterwarnings('ignore')
 6 plt.style.use('classic')
 7 x = np.linspace(0,10,100)
 8 fig = plt.figure()
 9 plt.plot(x,np.sin(x),'-')
10 plt.plot(x,np.cos(x),'--')
11 plt.show()
运行结果:
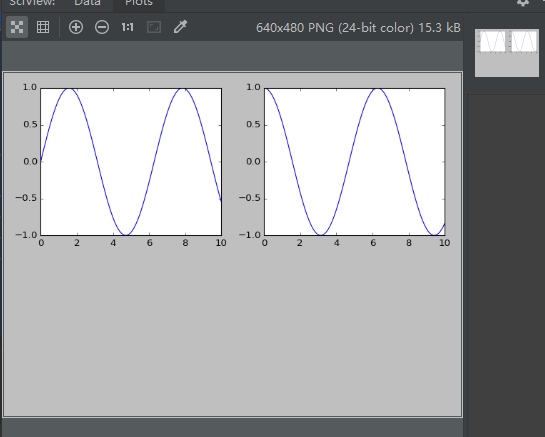
 1 import matplotlib as mpl
 2 import matplotlib.pyplot as plt
 3 import numpy as np
 4 import warnings
 5 warnings.filterwarnings('ignore')
 6 plt.style.use('classic')
 7 x = np.linspace(0,10,100)
 8 plt.figure()
 9 plt.subplot(2,2,1)
10 plt.plot(x,np.sin(x))
11 plt.subplot(2,2,2)
12 plt.plot(x,np.cos(x))
13 plt.show()
运行结果:
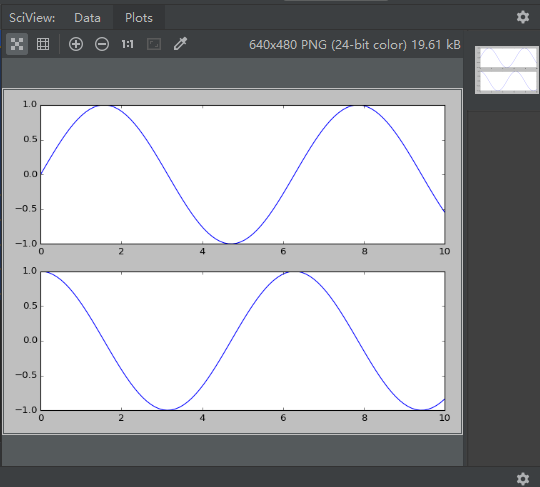
 1 import matplotlib as mpl
 2 import matplotlib.pyplot as plt
 3 import numpy as np
 4 import warnings
 5 warnings.filterwarnings('ignore')
 6 plt.style.use('classic')
 7 x = np.linspace(0,10,100)
 8 fig,ax=plt.subplots(2)#通过轴方式画图
 9 ax[0].plot(x,np.sin(x))
10 ax[1].plot(x,np.cos(x))
11 plt.show()
运行结果:
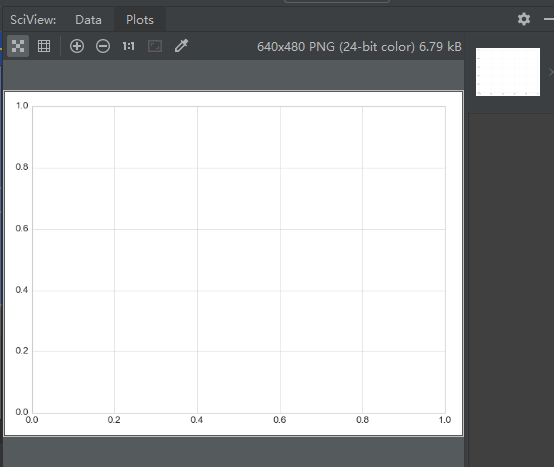
 1 import matplotlib as mpl
 2 import matplotlib.pyplot as plt
 3 import numpy as np
 4 import warnings
 5 warnings.filterwarnings('ignore')
 6 plt.style.use('classic')
 7 x = np.linspace(0,10,100)
 8 #底图风格
 9 plt.style.use('seaborn-whitegrid')
10 fig = plt.figure()
11 ax = plt.axes()
12 plt.show()
运行结果:
 1 import matplotlib as mpl
 2 import matplotlib.pyplot as plt
 3 import numpy as np
 4 import warnings
 5 warnings.filterwarnings('ignore')
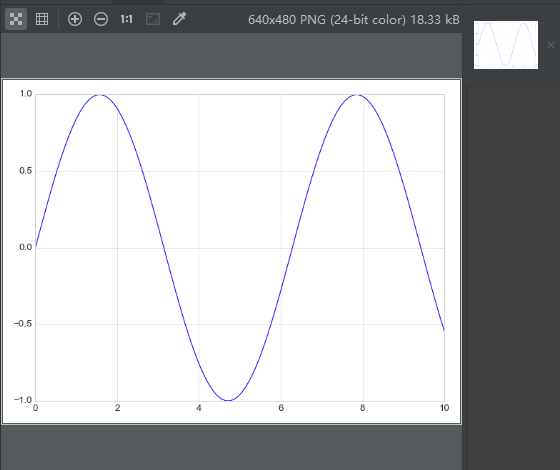
 6 plt.style.use('seaborn-whitegrid')
 7 fig = plt.figure()
 8 ax=plt.axes()
 9 x = np.linspace(0,10,100)
10 ax.plot(x,np.sin(x))
11 plt.sho
运行结果:
 1 import matplotlib as mpl
 2 import matplotlib.pyplot as plt
 3 import numpy as np
 4 import warnings
 5 warnings.filterwarnings('ignore')
 6 plt.style.use('seaborn-whitegrid')
 7 fig = plt.figure()
 8 ax=plt.axes()
 9 x = np.linspace(0,10,100)
10 ax.plot(x,np.sin(x))
11 #颜色调整
12 plt.plot(x,np.sin(x-0),color='blue')
13 plt.plot(x,np.sin(x-1),color='g')
14 plt.plot(x,np.sin(x-2),color='0.75')
15 plt.plot(x,np.sin(x-3),color='#FFC044')
16 plt.plot(x,np.sin(x-4),color=(1.0,0.2,0.3))
17 plt.plot(x,np.sin(x-5),color='chartreuse')
18 plt.plot(x,np.sin(x-6),color='pink')
19 plt.show()
运行结果:

 1 import matplotlib as mpl
 2 import matplotlib.pyplot as plt
 3 import numpy as np
 4 import warnings
 5 warnings.filterwarnings('ignore')
 6 plt.style.use('seaborn-whitegrid')
 7 fig = plt.figure()
 8 ax=plt.axes()
 9 x = np.linspace(0,10,100)11 #线条样式
12 plt.plot(x,x-0,linestyle='solid')
13 plt.plot(x,x-1,linestyle='dashed')
14 plt.plot(x,x-2,linestyle='dashdot')
15 plt.plot(x,x-3,linestyle='dotted')
16 plt.plot(x,x-4,linestyle='-')#solid
17 plt.plot(x,x-5,linestyle='--')#dashed
18 plt.plot(x,x-6,linestyle='-.')#dashdot
19 plt.plot(x,x-7,linestyle=':')#dotted
20 plt.show()
运行结果:

 1 import matplotlib as mpl
 2 import matplotlib.pyplot as plt
 3 import numpy as np
 4 import warnings
 5 warnings.filterwarnings('ignore')
 6 plt.style.use('seaborn-whitegrid')
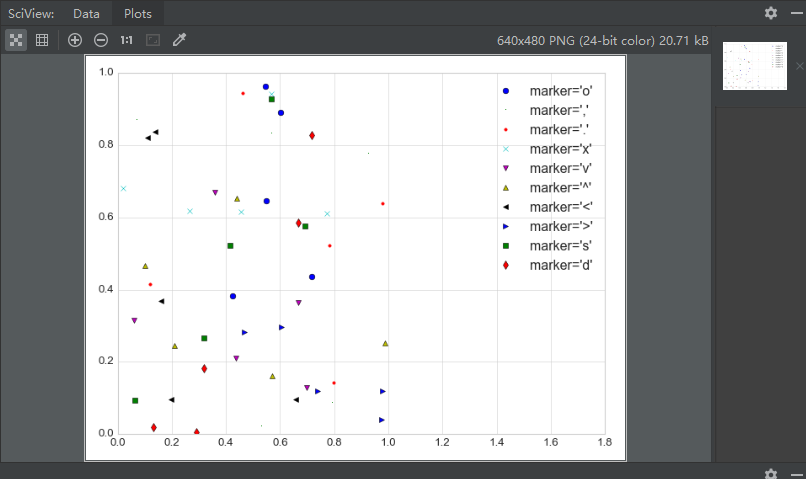
 7 fig = plt.figure()
 8 ax=plt.axes()
 9 x = np.linspace(0,10,100)
10 #标记展示
11 rng = np.random.RandomState(0)
12 for marker in ['o',',','.','x','v','^','<','>','s','d']:
13     plt.plot(rng.rand(5),rng.rand(5),marker,
14              label = "marker='{0}'".format(marker))
15 plt.legend(numpoints=1)
16 plt.xlim(0,1.8)
17 plt.show()
运行结果:
 1 import matplotlib as mpl
 2 import matplotlib.pyplot as plt
 3 import numpy as np
 4 import warnings
 5 warnings.filterwarnings('ignore')
 6 plt.style.use('seaborn-whitegrid')
 7 fig = plt.figure()
 8 ax=plt.axes()
 9 #散点图
10 x = np.linspace(0,10,30)
11 y = np.sin(x)
12 plt.plot(x,y,'o',color='red')
13 plt.show()
运行结果:

 1 import matplotlib as mpl
 2 import matplotlib.pyplot as plt
 3 import numpy as np
 4 import warnings
 5 warnings.filterwarnings('ignore')
 6 plt.style.use('seaborn-whitegrid')
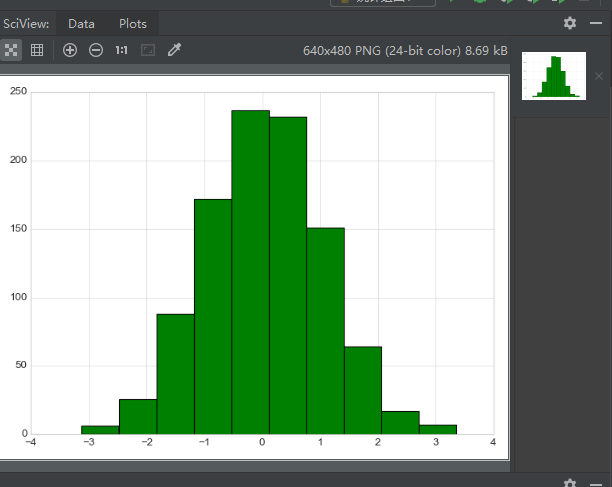
 7 fig = plt.figure()
 8 ax=plt.axes()
 9 #直方图
10 data = np.random.randn(1000)
11 plt.hist(data,color='g')
12 plt.show()
运行结果:
 1 import matplotlib as mpl
 2 import matplotlib.pyplot as plt
 3 import numpy as np
 4 import warnings
 5 warnings.filterwarnings('ignore') 9 #直方图
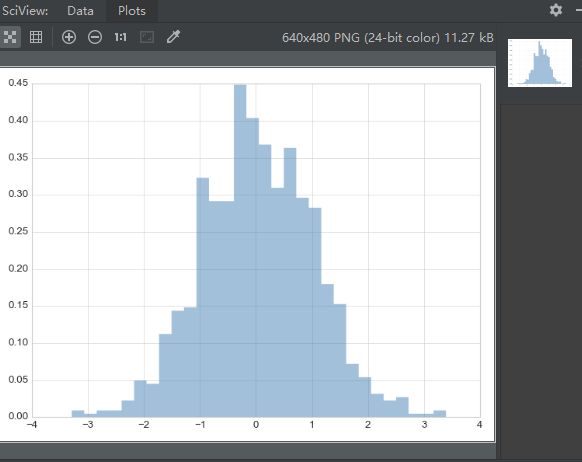
10 data = np.random.randn(1000)
11 plt.hist(data,bins=30,normed=True,alpha=0.5,
12          histtype='stepfilled',color='steelblue',
13          edgecolor='none')
14 plt.show()
运行结果:
 1 import matplotlib as mpl
 2 import matplotlib.pyplot as plt
 3 import numpy as np
 4 import warnings
 5 warnings.filterwarnings('ignore')
 6 #直方图
 7 x1 = np.random.normal(0,0.8,1000)
 8 x2 = np.random.normal(-2,1,1000)
 9 x3 = np.random.normal(3,2,1000)
10 kwargs = dict(histtype='stepfilled',alpha=0.3,normed=True,bins=40)
11 plt.hist(x1,**kwargs)
12 plt.hist(x2,**kwargs)
13 plt.hist(x3,**kwargs)
14 plt.show()
运行结果:


【推荐】编程新体验,更懂你的AI,立即体验豆包MarsCode编程助手
【推荐】凌霞软件回馈社区,博客园 & 1Panel & Halo 联合会员上线
【推荐】抖音旗下AI助手豆包,你的智能百科全书,全免费不限次数
【推荐】轻量又高性能的 SSH 工具 IShell:AI 加持,快人一步
· SQL Server 内存占用高分析
· .NET Core GC计划阶段(plan_phase)底层原理浅谈
· .NET开发智能桌面机器人:用.NET IoT库编写驱动控制两个屏幕
· 用纯.NET开发并制作一个智能桌面机器人:从.NET IoT入门开始
· 一个超经典 WinForm,WPF 卡死问题的终极反思
· 支付宝事故这事儿,凭什么又是程序员背锅?有没有可能是这样的...
· 在线客服系统 QPS 突破 240/秒,连接数突破 4000,日请求数接近1000万次,.NET 多
· C# 开发工具Visual Studio 介绍
· 在 Windows 10 上实现免密码 SSH 登录
· C#中如何使用异步编程