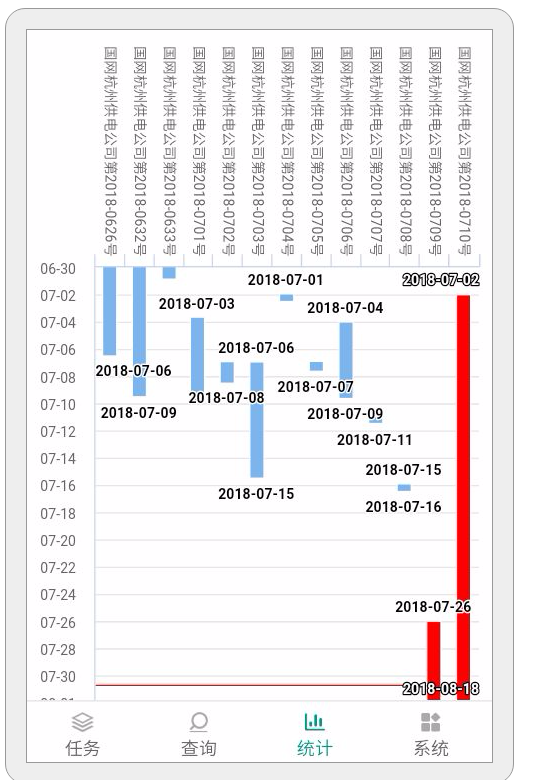
highcharts配置的效果如下

配置如下:
function init(categoryArray,seriesData,month_first_day,month_last_day,currDay){
    var chart = Highcharts.chart('container', {
        chart: {
            type: 'columnrange',// columnrange 依赖 highcharts-more.js
            inverted: false
        },
        title: {
            // text: '持续时间统计'
            text: ''
        },
        // subtitle: {
        //     text: 'Observed in Vik i Sogn, Norway, 2017'
        // },
        xAxis: {
            opposite : true,
            // categories : categoryArray,
            // title: {
            //     text: '持续时间'
            //     // text: ''
            // },
            // lineColor: "red",
            labels: {
                rotation: 90,//横坐标文字旋转角度
                style: {
                    // fontSize: '13px',
                    // fontFamily: 'Verdana, sans-serif',
                    // writingMode:'tb-rl'    //文字竖排样式
                }
            },
            // categories: ['Jan', 'Feb', 'Mar']
            categories: categoryArray
        },

        yAxis: {
            opposite : false,
            reversed: true,
            title: {
                // text: '持续时间'
                text: ''
            },
            plotLines: [{//这是个数组,可以添加无数条贯穿全场的横竖线
                color: '#FF0000',
                width: 1,
                value: currDay
            }],
            lineWidth : 1,//y轴线的宽度
            tickWidth : 0,//刻度线
            // lineColor: "#7cb5ec",
            // tickAmount: 31,//刻度线总数
            // gridLineColor: '#197F07',
            // gridLineWidth: 1,
            tickInterval: 24*60*60*1000,//刻度间隔(天)
            // min : Date.UTC(2018, 5, 1),
            // max : Date.UTC(2018, 8, 1),
            min : month_first_day,//时间戳格式
            max : month_last_day,
            labels: {
                    formatter: function () {
                        // return Highcharts.dateFormat('%Y-%m-%d', this.value)
                        return Highcharts.dateFormat('%m-%d', this.value);
                    }
            }
            },
        tooltip: {
            // valueSuffix: '天'
            // useHTML: true,
            // headerFormat: '<small>{point.key}</small><table>',
            // pointFormat: '<tr><td style="color: {series.color}">{series.name}: </td>' +
            // '<td style="text-align: right"><b>'+'{point.low} 至 {point.high}'+'</b></td></tr>',
            // footerFormat: '</table>',
            formatter: function () {
                return "<span style=\"color:green\">" + this.key + "</span>" + " <br/>" +
                    "<span style=\"color:cornflowerblue\">" + this.point.className + "</span>" + " <br/>" +
                    "预警时间: " + Highcharts.dateFormat('%Y-%m-%d', this.point.low) + " 至 " + Highcharts.dateFormat('%Y-%m-%d', this.point.high);
            }
        },
        plotOptions: {
            columnrange: {
                dataLabels: {
                    enabled: true,
                    // format: '{y}',
                    // format: '',
                    formatter: function (){
                        return Highcharts.dateFormat('%Y-%m-%d', this.y);
                    }
                }
            }
        },

        legend: {
            enabled: false
        },

        series: [{
            name: '预警时间',
            data: seriesData
            // data: [
            //     [1526776200000,1528115400000],
            //     [1526430600000,1527856200000],
            //     [1527813000000,1530361800000]
            // ]
            // data:[{
            //     // name: 'Point 1',//等同于this.key
            //     className: 'Point 1',
            //     // color: '#00FF00',
            //     low:1526776200000,
            //     high:1528115400000,
            // },{
            //     className: 'Point 2',
            //     // color: '#00FF00',
            //     low:1526430600000,
            //     high:1527856200000
            // },{
            //     className: 'Point 3',
            //     // color: '#00FF00',
            //     low:1527813000000,
            //     high:1530361800000
            // }]

            // data: [
            //     [Date.UTC(2018, 6, 1), Date.UTC(2018, 6, 30)],
            //     [Date.UTC(2018, 6, 1), Date.UTC(2018, 6, 30)],
            //     [Date.UTC(2018, 6, 1), Date.UTC(2018, 6, 30)],
            //     // [Highcharts.dateFormat('%Y-%m-%d', Date.UTC(2018, 6, 1)), Highcharts.dateFormat('%Y-%m-%d', Date.UTC(2018, 6, 30))],
            //     // [Highcharts.dateFormat('%Y-%m-%d', Date.UTC(2018, 6, 1)), Highcharts.dateFormat('%Y-%m-%d', Date.UTC(2018, 6, 30))],
            //     // [Highcharts.dateFormat('%Y-%m-%d', Date.UTC(2018, 6, 1)), Highcharts.dateFormat('%Y-%m-%d', Date.UTC(2018, 6, 30))],
            // ]
            // ,dataLabels:{
            //     format: '{y}ccc'
            // }
        }]

    });

    // console.dir(chart.yAxis[0]);
    // chart.yAxis[0].update({
    //     gridLineColor: 'red'
    // });
}
不积跬步无以至千里,不积小流无以成江海


