

kibana 部署及日志收集展示

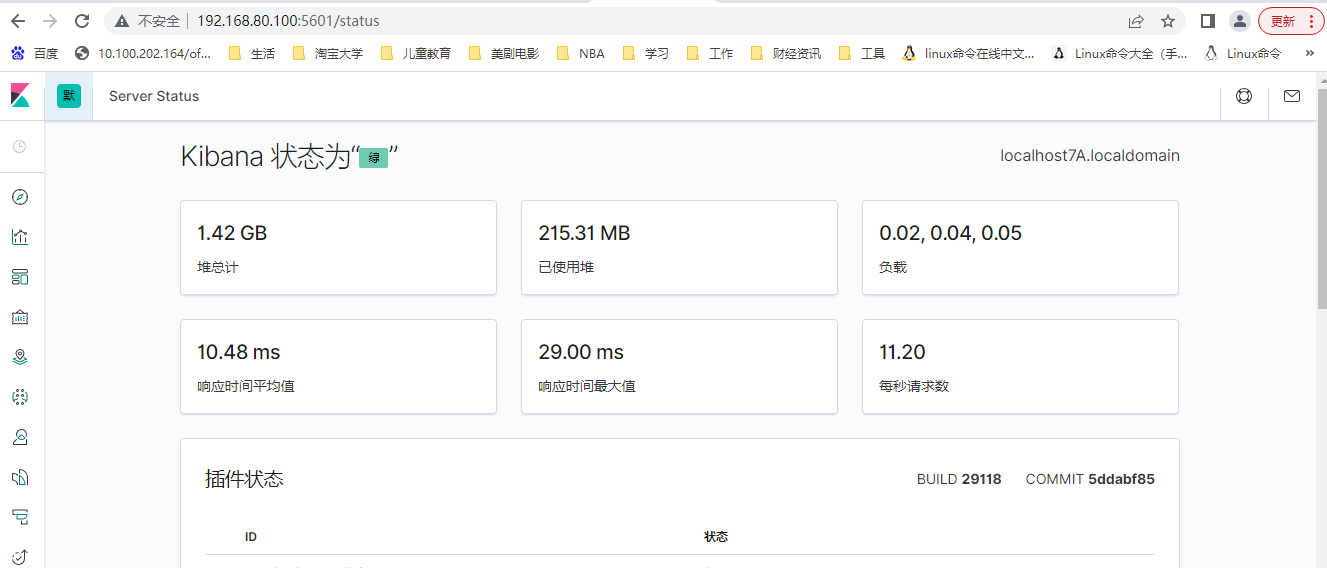
kibana 部署及日志收集:
Kibana 是一款开源的数据分析和可视化平台,它是 Elastic Stack 成员之一,设计用于和 Elasticsearch 协作,可以使用 Kibana 对 Elasticsearch 索引中的数据进行
搜索、查看、交互操作,您可以很方便的利用图表、表格及地图对数据进行多元化的分析和呈现。
可采集的日志(Nginx、系统指标、Iptables、系统日志、Apache、AWS Cloudwatch 、Elasticsearch、IBM MQ 、IIS、Kafka、Logstash、MySQL  、PostgreSQL、Redis  等等)

1:rpm 方式:
#yum localinstall kibana-5.3.0-x86_64.rpm
# grep -n "^[a-Z]" /etc/kibana/kibana.yml
2:server.port: 5601 #监听端口
7:server.host: "0.0.0.0" #监听地址
28:elasticsearch.hosts: ["http://192.168.80.100:9200"]
114:i18n.locale: "zh-CN" #支持中文

2:启动 kibana 服务并验证:
[root@linux-host1 ~]# systemctl start kibana
[root@linux-host1 ~]# systemctl enable kibana
[root@linux-host1 ~]# ss -tnl | grep 5601
3.1.3:查看状态:
http://192.168.80.130:5601/status
实验说明
192.168.80.100 localhost7A.localdomain    node1   head  cerebro  kibana
192.168.80.110 localhost7B.localdomain    node2
192.168.80.120 localhost7C.localdomain    node3
192.168.80.130 localhost7D.localdomain    logstash   nginx   tomcat


#ES群集配置文件
[root@localhost7A ~]# grep  -v  ^#  /usr/local/elasticsearch-7.6.1/config/elasticsearch.yml
cluster.name: ZZHZ
node.name: node-1
path.data: /usr/local/elasticsearch-7.6.1/data
path.logs: /usr/local/elasticsearch-7.6.1/logs
network.host: 0.0.0.0
http.port: 9200
discovery.seed_hosts: ["192.168.80.100", "192.168.80.110", "192.168.80.120"]
cluster.initial_master_nodes: ["192.168.80.100", "192.168.80.110", "192.168.80.120"]
gateway.recover_after_nodes: 2

http.cors.enabled: true
http.cors.allow-origin: "*"
收集 nginx 访问日志:
注意/var/log/nginx/access.log权限,logstash使用root启动或文件添加logstash读权限。

日志格式:
log_format access_json '{"@timestamp":"$time_iso8601",'
 '"host":"$server_addr",'
 '"clientip":"$remote_addr",'
 '"size":"$body_bytes_sent",'
 '"responsetime":"$request_time",'
 '"upstreamtime":"$upstream_response_time",'
 '"upstreamhost":"$upstream_addr",'
 '"http_host":"$host",'
 '"url":"$uri",'
 '"domain":"$host",'
 '"xff":"$http_x_forwarded_for",'
 '"referer":"$http_referer",'
 '"status":"$status"}';
    access_log  /var/log/nginx/access.log  access_json;


logstash配置文件

input {
  file {
    path => "/var/log/nginx/access.log"
    start_position => "beginning"
    type => "nginx-accesslog"
    codec => json
  }
}

output {
  if [type] == "nginx-accesslog" {
    elasticsearch {
    hosts => ["192.168.80.100:9200"]
    index => "linux_nginx_accesslog_140_%{+YYYY.MM.dd}"
    }
  }
}
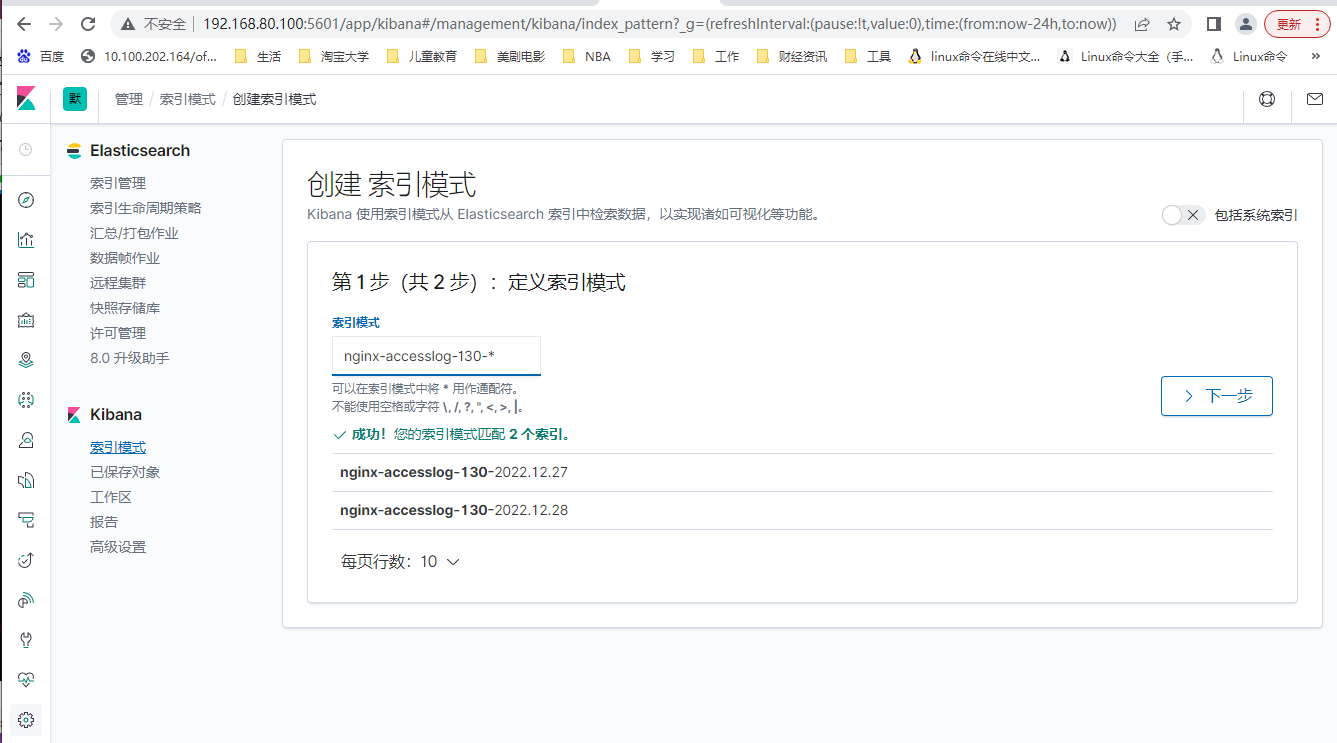
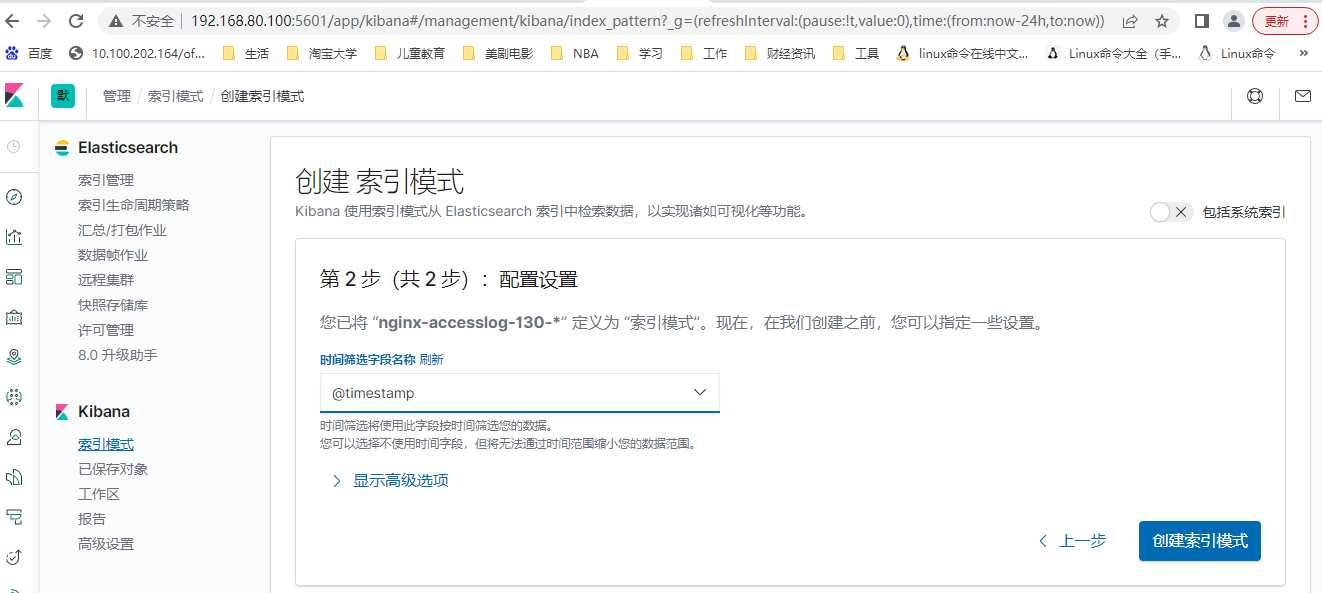
在http://192.168.80.100:5601 中management--》kibana --》 index-mode 创建索引模式:名称nginx-accesslog-130-*
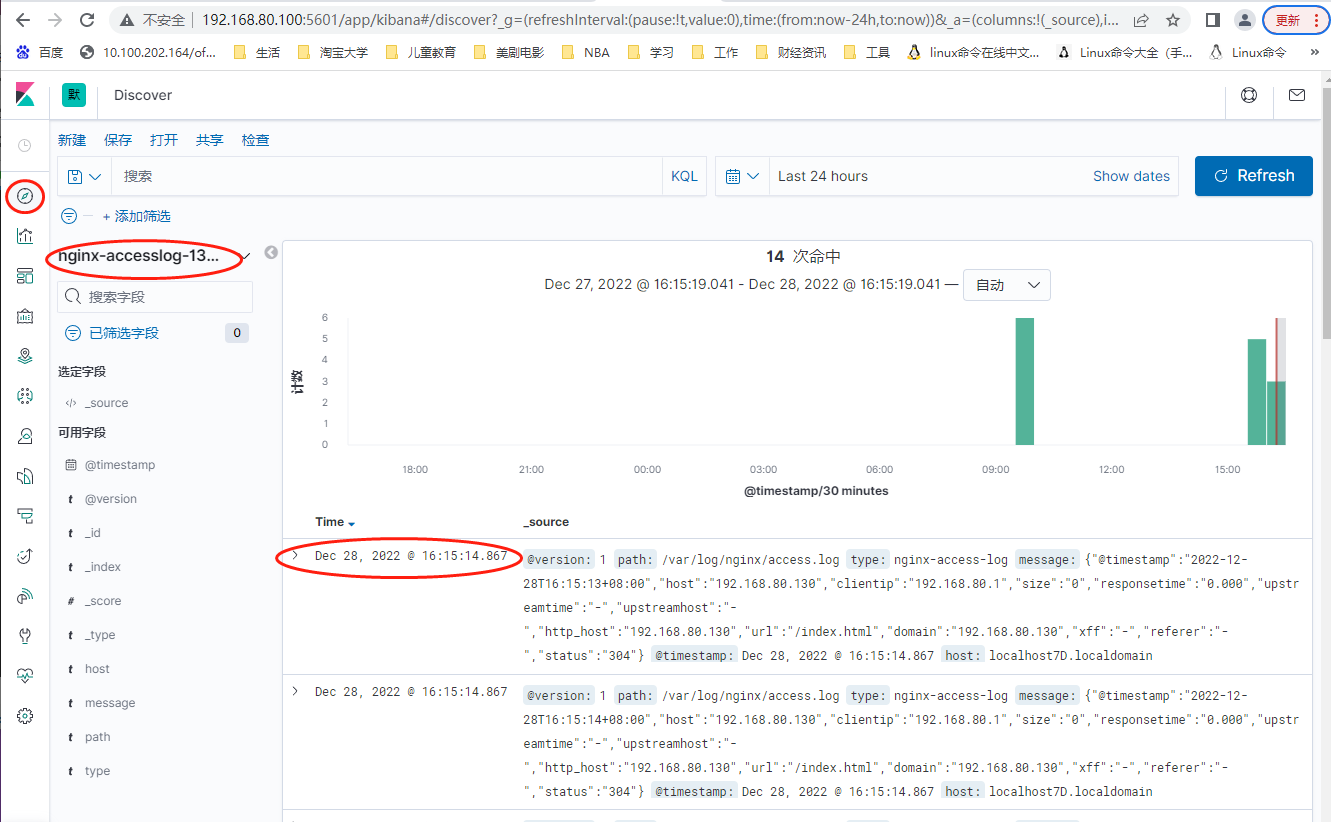
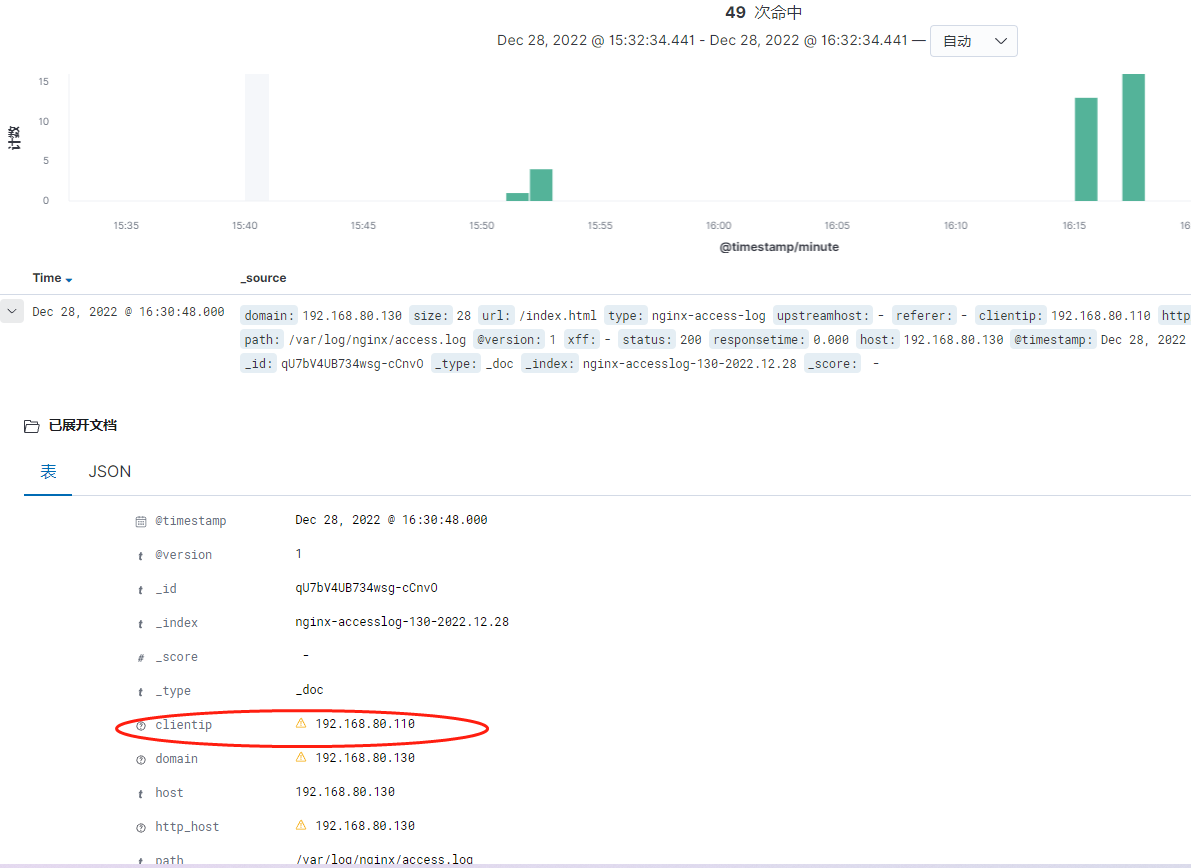
在http://192.168.80.100:5601 中disover中查看日志信息
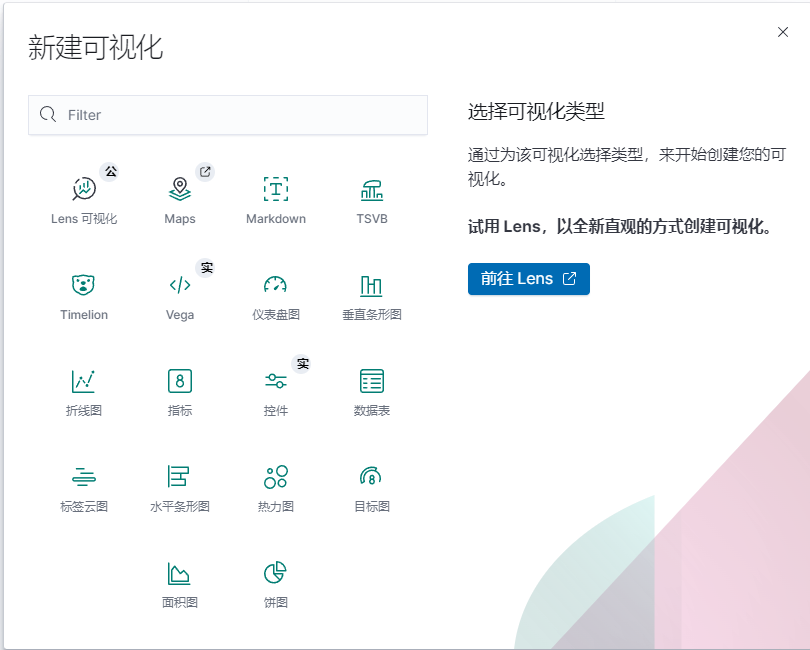
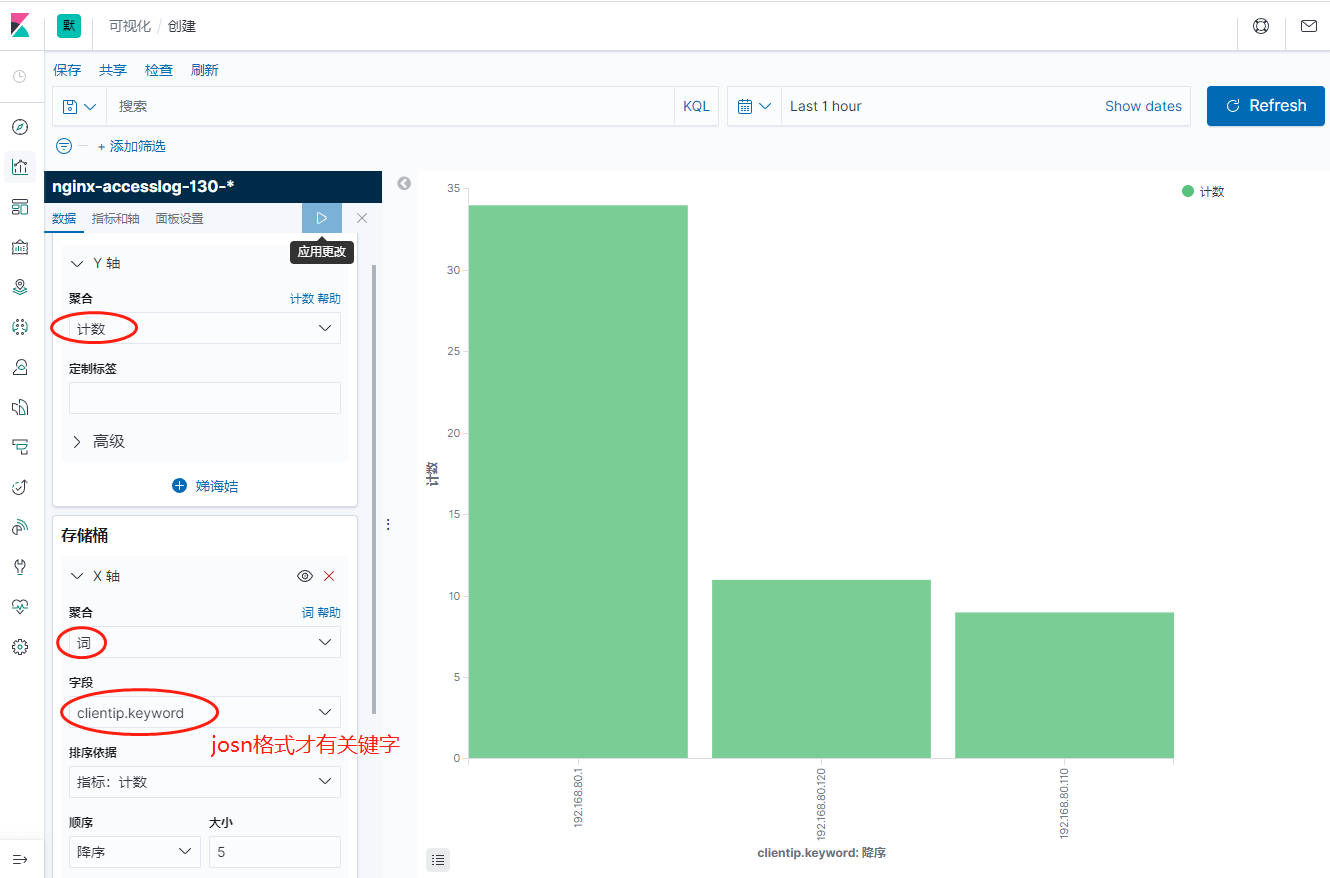
在kibana的Visualize 进行可视化图形 ,可视化图形日志必须是json格式


【推荐】国内首个AI IDE,深度理解中文开发场景,立即下载体验Trae
【推荐】编程新体验,更懂你的AI,立即体验豆包MarsCode编程助手
【推荐】抖音旗下AI助手豆包,你的智能百科全书,全免费不限次数
【推荐】轻量又高性能的 SSH 工具 IShell:AI 加持,快人一步
· Manus爆火,是硬核还是营销?
· 终于写完轮子一部分:tcp代理 了,记录一下
· 别再用vector<bool>了!Google高级工程师:这可能是STL最大的设计失误
· 单元测试从入门到精通
· 震惊!C++程序真的从main开始吗?99%的程序员都答错了