HaPorxy 状态页说明
HAProxy状态页:通过web界面,显示当前HAProxy的运行状态
stats enable #基于默认的参数启用stats page
stats hide-version #将状态页中haproxy版本隐藏
stats refresh <delay> #设定自动刷新时间间隔,默认不自动刷新
stats uri <prefix> #自定义stats page uri,默认值:/haproxy?stats
stats realm <realm> #账户认证时的提示信息,示例:stats realm HAProxy\ Statistics
stats auth <user>:<passwd> #认证时的账号和密码,可使用多次,默认:no authentication,可有多行用户
stats admin { if | unless } <cond> #启用stats page中的管理功能,不建议打开
[root@localhost7B haproxy-2.0.22]# vim /etc/haproxy/haproxy.cfg

gid 99
daemon
#nbproc 4
global
maxconn 100000
chroot /usr/local/haproxy
stats socket /var/lib/haproxy/haproxy.sock mode 600 level admin
uid 99
gid 99
daemon
pidfile /var/lib/haproxy/haproxy.pid
log 127.0.0.1 local3 info


defaults
option http-keep-alive
option forwardfor
maxconn 100000
mode http
timeout connect 300000ms
timeout client 300000ms
timeout server 300000ms


listen stats
mode http
bind 0.0.0.0:9999
stats enable
log global
stats uri /haproxy-status
stats auth admin:123456


listen zzhz
    bind 192.168.80.110:81 #IP地址
    mode http
    log global
    server web1 192.168.80.110:80 check inter 3000 fall 2 rise 5


frontend zjol
    bind 192.168.80.110:82
    mode http
    use_backend zjol_node
backend zjol_node
    mode http
    option forwardfor
    server we2 192.168.80.120:80 check inter 3000 fall 3 rise 5

listen web_host
    bind 192.168.80.110:83
    mode http
    log global
    acl web_host hdr_dom(host) www.magedu.net
    use_backend web_host_node if web_host
    backend web_host_node
    mode http
        server web3 192.168.80.110:80 check inter 2000 fall 3 rise 5
        server web4 192.168.80.120:80 check inter 2000 fall 3 rise 5
HAProxy状态页说明:
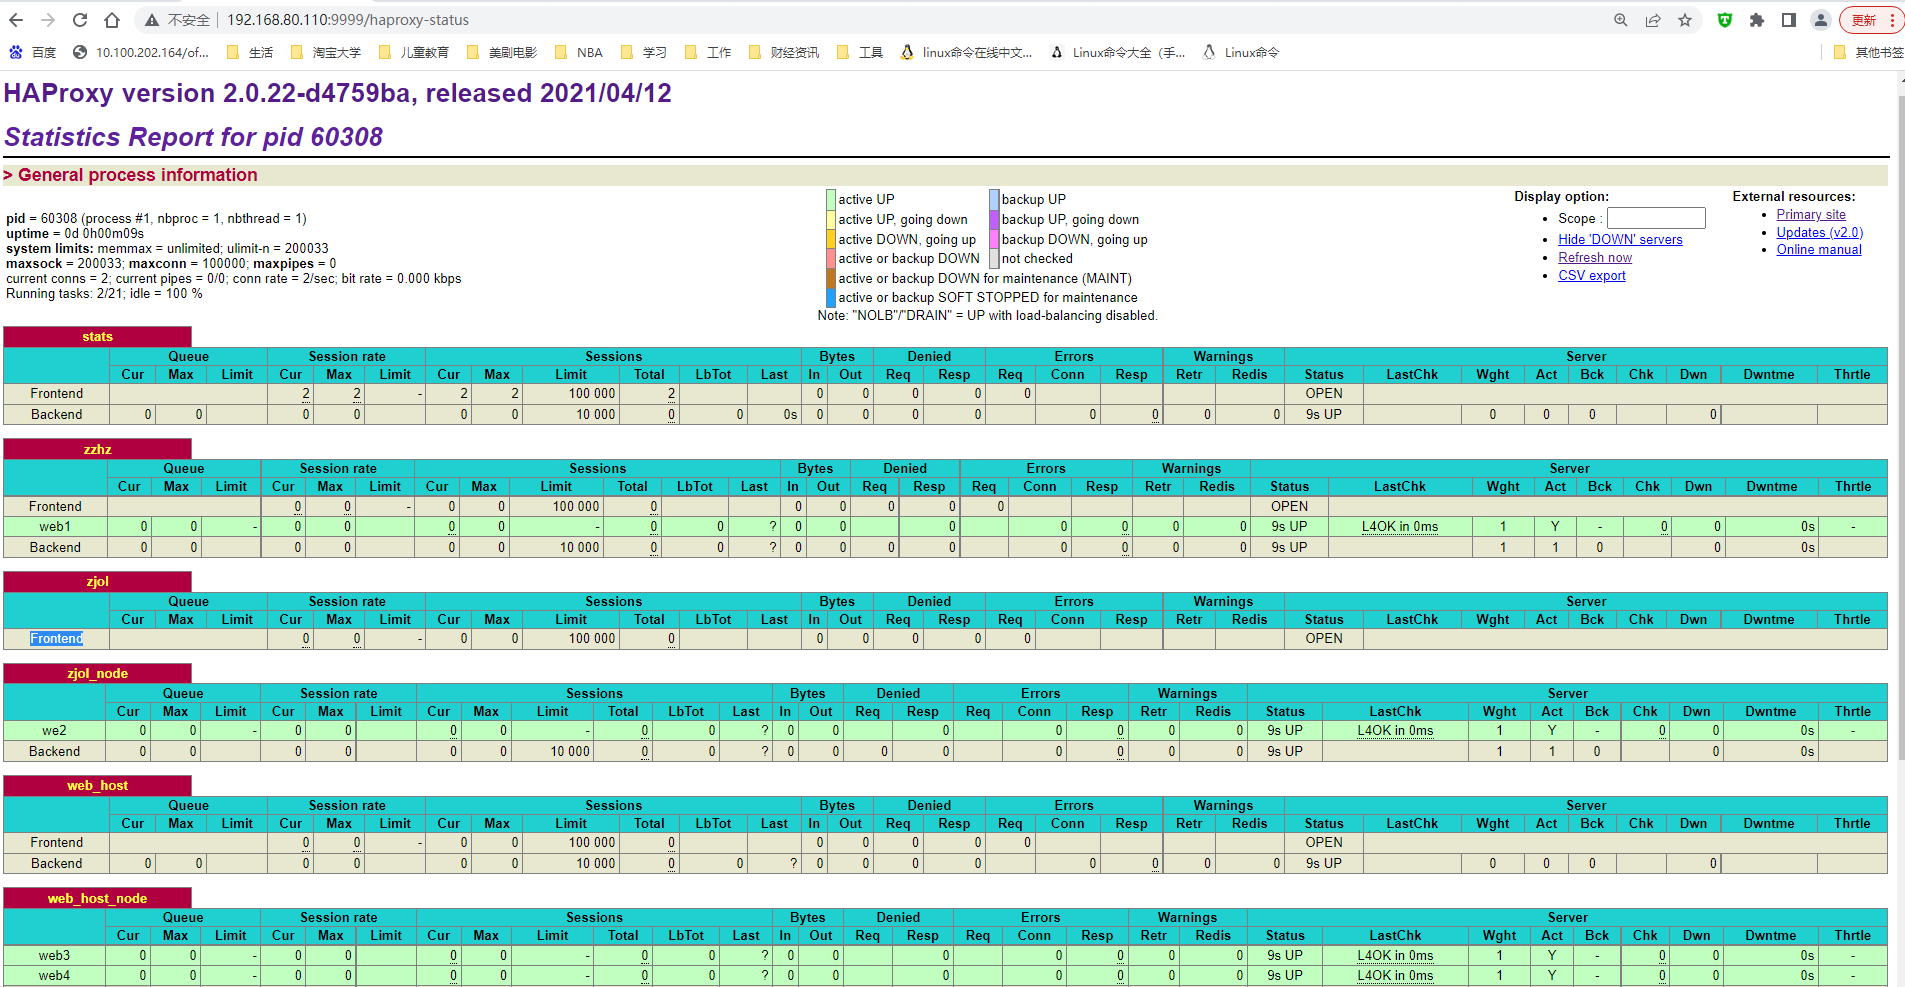
pid = 27134 (process #3, nbproc = 4, nbthread = 1) 	 #pid为当前pid号,process为当前进程号,nbproc和nbthread为一共多少进程和每个进程多少个线程
uptime = 0d 0h00m04s								 #启动了多长时间
system limits: memmax = unlimited; ulimit-n = 200029 #系统资源限制:内存/最大打开文件数/
maxsock = 200029; maxconn = 100000; maxpipes = 0 	 #最大socket连接数/单进程最大连接数/最大管道数maxpipes
current conns = 2; current pipes = 0/0; conn rate = 2/sec; bit rate = 0.000 kbps #当前连接数/当前管道数/当前连接速率
Running tasks: 1/14; idle = 100 %        #运行的任务/当前空闲率


active UP:                              #在线服务器
active UP, going down:                  #监测未通过正在进入down过程
active DOWN, going up:                  #down的服务器正在进入up过程
active or backup DOWN:                  #在线的服务器或者是backup的服务器已经转换成了down状态
backup UP:                              #标记为backup的服务器
backup UP, going down:                  #备份服务器正在进入down过程
backup DOWN, going up:                  #备份服务器正在进入up过程
not checked:                            #标记为不监测的服务器
active or backup DOWN for maintenance (MAINT) #active或者backup服务器人为下线的
active or backup SOFT STOPPED for maintenance #active或者backup被人为软下线(人为将weight改成0)


backend server信息:
Queue
	Cur
	Max
	Limit
session rate(每秒的连接会话信息):
	cur:每秒的当前会话数量
	max:每秒新的最大会话数量
	limit:每秒新的会话限制量
sessions(会话信息):
	cur:当前会话量
	max:最大会话量
	limit: 限制会话量
	Total:总共会话量
	LBTot:选中一台服务器所用的总时间
	Last:和服务器的持续连接时间
Bytes(流量统计):
	In:网络的字节输入总量
	Out:网络的字节输出总量
Denied(拒绝统计信息):
	Req:拒绝请求量
	Resp:拒绝回复量
Errors(错误统计信息):
	Req:错误请求量
	conn:错误链接量
	Resp:错误响应量
Warnings(警告统计信息):
	Retr:重新尝试次数
	Redis:再次发送次数
Server(real server信息):
	Status:后端机的状态,包括UP和DOWN
	LastChk:持续检查后端服务器的时间
	Wght:权重
	Act:活动链接数量
	Bck:备份的服务器数量
	Chk:心跳检测时间
	Dwn:后端服务器连接后都是DOWN的数量
	Dwntme:总的downtime时间
	Thrtle:server 状态
利用状态页实现haproxy服务器的健康性检查
范例:通过curl 命令对haproxy的状态页的访问实现健康检查

[root@centos8 ~]#curl -I  http://haadmin:123456@192.168.80.110:9999/haproxy-status

[root@centos8 ~]#curl -I -u haadmin:123456  http://192.168.80.110:9999/haproxy-status
HTTP/1.1 200 OK
cache-control: no-cache
content-type: text/html

[root@centos8 ~]#echo $?
0

[root@haproxy ~]#systemctl stop haproxy
[root@centos8 ~]#curl -I  http://haadmin:123456@192.168.80.110:9999/haproxy-status
curl: (7) Failed to connect to 192.168.80.110 port 9999: Connection refused
[root@centos8 ~]#echo $?7

 浙公网安备 33010602011771号