echarts 关系图 与节点显隐的切换事件实例

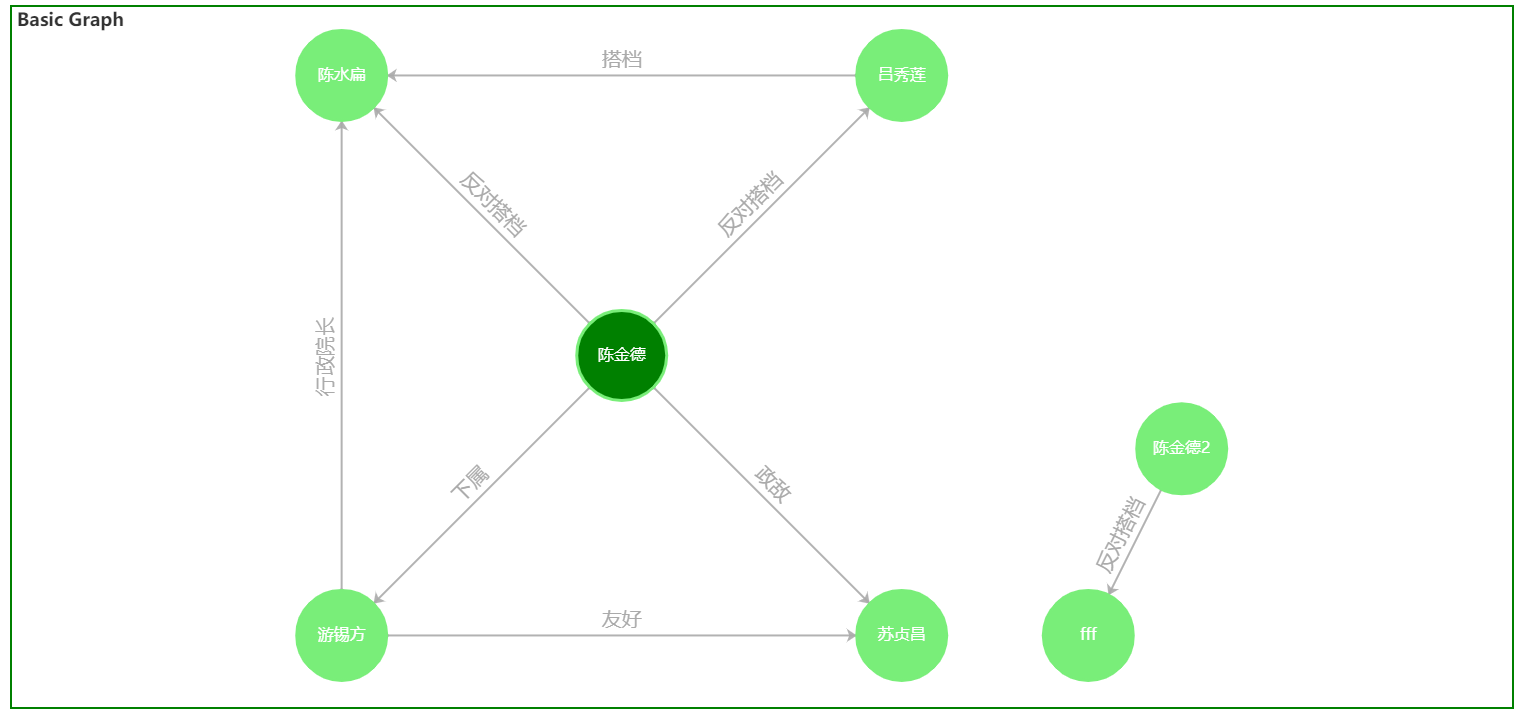
如标题所言,echarts可以用来绘制关系图,效果图如下:


实例如下:

<!DOCTYPE html>
<html>
    <head>
        <meta charset="utf-8">
        <title>关系图</title>
        <script src="js/echarts.min.js"></script>
        <style>
            #main {
                width: 1500px;
                height: 700px;
                margin: auto;
                border: 2px solid green;
            }
        </style>
    </head>
    <body>
        <div id='main'></div>
        <script type="text/javascript">
            var count = 0;
            var nodeData = [{
                    name: '陈金德',
                    x: 30,
                    y: 30,
                },
                {
                    name: '陈水扁',
                    x: 0,
                    y: 0
                },
                {
                    name: '吕秀莲',
                    x: 60,
                    y: 0
                },
                {
                    name: '苏贞昌',
                    x: 60,
                    y: 60
                },
                {
                    name: '游锡方',
                    x: 0,
                    y: 60
                },
                {
                    name: 'fff',
                    x: 80,
                    y: 60
                },
                {
                    name: '陈金德2',
                    x: 90,
                    y: 40
                },

            ];

            var linkData = [
                {
                        source: '陈金德2',
                        target: 'fff',
                        value: '反对搭档',
                        label: {
                            show: true,
                            formatter: (params) => {
                                return params.value;
                            }
                        },
                    },
                {
                    source: '陈金德',
                    target: '陈水扁',
                    value: '反对搭档',
                    label: {
                        show: true,
                        formatter: (params) => {
                            return params.value;
                        }
                    },
                },
                {
                    source: '陈金德',
                    target: '吕秀莲',
                    value: '反对搭档',
                    label: {
                        show: true,
                        formatter: (params) => {
                            return params.value;
                        }
                    },
                },
                {
                    source: '陈金德',
                    target: '苏贞昌',
                    value: '政敌',
                    label: {
                        show: true,
                        formatter: (params) => {
                            return params.value;
                        }
                    },
                },
                {
                    source: '陈金德',
                    target: '游锡方',
                    value: '下属',
                    label: {
                        show: true,
                        formatter: (params) => {
                            return params.value;
                        }
                    },
                },
                {
                    source: '吕秀莲',
                    target: '陈水扁',
                    value: '搭档',
                    label: {
                        show: true,
                        formatter: (params) => {
                            return params.value;
                        }
                    },
                },
                {
                    source: '游锡方',
                    target: '陈水扁',
                    value: '行政院长',
                    label: {
                        show: true,
                        formatter: (params) => {
                            return params.value;
                        }
                    },
                },
                {
                    source: '游锡方',
                    target: '苏贞昌',
                    value: '友好',
                    label: {
                        show: true,
                        formatter: (params) => {
                            return params.value;
                        }
                    },
                }
            ]

            inits()

            function inits() {
                var option = {
                    title: {
                        text: 'Basic Graph'
                    },
                    tooltip: {},
                    animationDurationUpdate: 1500,
                    animationEasingUpdate: 'quinticInOut',
                    series: [{
                        type: 'graph',
                        layout: 'none',
                        symbolSize: 90,
                        // size: 150,

                        roam: true,
                        label: {
                            show: true
                        },
                        itemStyle: {
                            normal: {
                                // color: "#008000",//节点颜色
                                color: function(params) {
                                    var colorList = ['#008000', '#79ee79'];
                                    return colorList[params.dataIndex]
                                },
                                borderColor: '#79ee79',
                                borderWidth: 3,
                                label: {
                                    show: true,
                                    textStyle: {
                                        color: 'white',
                                        fontSize: 16
                                    },
                                    // position: 'bottom',//标签位置
                                    // distance: 20//标签距离图形的距离(标签不在图形里面才有效果)
                                },
                                nodeStyle: {
                                    brushType: 'both',
                                    borderColor: 'rgba(255,215,0,0.4)',
                                    borderWidth: 1
                                },
                                linkStyle: {
                                    type: 'line'
                                }
                            },
                        },
                        // color: '#008000',
                        edgeSymbol: ['circle', 'arrow'],
                        edgeSymbolSize: [4, 10],
                        edgeLabel: {
                            fontSize: 20
                        },
                        data: nodeData,
                        links: linkData,
                        lineStyle: {
                            opacity: 0.9,
                            width: 2,
                            curveness: 0
                        }
                    }]
                };

                echarts.init(document.getElementById('main')).setOption(option);


                // 点击事件
                echarts.init(document.getElementById('main')).on('click', function(params) {

                    if (params.dataType == 'node') {
                        if (params.name == "陈金德") {
                            var option2 = {
                                title: {
                                    text: 'Basic Graph'
                                },
                                tooltip: {},
                                animationDurationUpdate: 1500,
                                animationEasingUpdate: 'quinticInOut',
                                series: [{
                                    type: 'graph',
                                    layout: 'none',
                                    symbolSize: 90,
                                    roam: true,
                                    label: {
                                        show: true
                                    },
                                    itemStyle: {
                                        normal: {
                                            // color: "#008000",//节点颜色
                                            color: function(params) {
                                                var colorList = ['#008000', '#79ee79'];
                                                return colorList[params.dataIndex]
                                            },
                                            borderColor: '#79ee79',//边框线颜色
                                            borderWidth: 3,//边框粗细
                                            label: {
                                                show: true,
                                                textStyle: {//节点的文本样式
                                                    color: 'white',
                                                    fontSize: 16
                                                },
                                                // position: 'bottom',//标签位置
                                                // distance: 20//标签距离图形的距离(标签不在图形里面才有效果)
                                            },
                                            //nodeStyle: {
                                            //  brushType: 'both',
                                            //  borderColor: 'rgba(255,215,0,0.4)',
                                            //  borderWidth: 1
                                            //},
                                            linkStyle: {
                                                type: 'line'
                                            }
                                        },
                                    },
                                    edgeSymbol: ['circle', 'arrow'],
                                    edgeSymbolSize: [4, 10],
                                    edgeLabel: {
                                        fontSize: 20
                                    },
                                    data: [{
                                        name: '陈金德',
                                        x: 30,
                                        y: 30,
                                    }],
                                    links: [],
                                    lineStyle: {
                                        opacity: 0.9,
                                        width: 2,
                                        curveness: 0
                                    }
                                }]
                            };

                            count++;
                 //关系图这里直接用setOption重绘图表无效,包括document.getElementById(id).removeAttribute('_echarts_instance_')方式清除图表也不生效,
                  所以直接通过clear()方式来清除图表,再绘制,从而达到显隐切换的目的 echarts.init(document.getElementById(
'main')).clear(); if (count % 2 != 0) { echarts.init(document.getElementById('main')).setOption(option2, true); } else { echarts.init(document.getElementById('main')).setOption(option, true); } } } }); } </script> </body> </html>

官网实例:

https://echarts.apache.org/examples/zh/editor.html?c=graph-simple

官网外参考了下面几个链接:

(26条消息) echarts的graph里的links的起点和终点设置无效_Fimooo的博客-CSDN博客_echarts links

Echarts图表插件(4.x版本)使用(二、带分类筛选的多个图表/实例化多个ECharts,以关系图/force为例) - 负了韶华不负卿 - 博客园 (cnblogs.com)

(26条消息) echarts关系图节点颜色大小配置及节点点击事件(直接复制粘贴到官网即可运行)_jyq9222的博客-CSDN博客_echarts关系图节点颜色

(26条消息) echarts重绘 - CSDN


posted @ 2022-07-14 15:51  逸凨  阅读(1134)  评论(0编辑  收藏  举报