

echarts 图例配置监听事件实现链接跳转
首先在 ECharts 中主要通过 on 方法添加事件处理函数,而echarts图表中封装了切换图例选中状态后的事件函数: legendselectchanged。【简单的说就是点击、切换图例的时候会调用legendselectchanged函数】,所以当我们需要对点击切换图例做一些js操作时,可以直接调用legendselectchanged函数
例如:给图例【待下发、处置中、已完成】配置链接跳转:点击待下发图例跳转到/modules/order/AlarmOrderListPlus路由对应的***页面....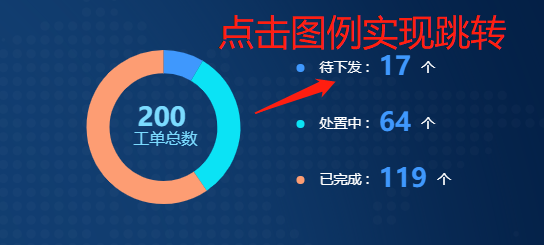
关键代码如下:
pieChart.on('legendselectchanged', function(obj) {
        // var selected = obj.selected;
        var legend = obj.name;

        if(legend == '待下发'){
          that.$router.push('/modules/order/AlarmOrderListPlus')
        }
        else if(legend == '处置中'){
          that.$router.push('/modules/order/AlarmOrderOngoingList')
        }else{
          that.$router.push('/modules/order/AlarmOrderCompleteList')
        }
    })
完整组件示例代码如下:
<template>
  <div class="repair-order">
    <!-- 工单统计 -->
    <img src="~@/assets/datav/title-2.png" />
    <div id="pieChart" class="pie-chart" ></div>
  </div>
</template>
<script>
import * as echarts from 'echarts'
import { color } from 'echarts'
import { getAction } from '@api/manage'
export default {
  name: 'repairOrder',
  components: {},
  computed: {},
  data() {
    return {
      url:{
        pieData:'接口url',
        monitor:'接口url'
      },
      pieData:[],
      totalCount:0,
    }
  },
  mounted() {
    this.handleGetPieData();
    setInterval(()=>{
               this.handleGetPieData();
           },30000)

  },
  methods: {

    handleGetPieData() {
      this.pieData =[];
      this.totalCount =0;
      if (!this.url.pieData) {
        this.$message.error('请设置url.pieData 属性!')
        return
      }
      getAction(this.url.pieData).then((res) => {

        for(let i=0;i<res.length;i++){
          this.pieData.push({'name': res[i].x, 'value': res[i].y});
          this.totalCount += +res[i].y;
        }

        this.initPieChart()
        console.log('总数:',this.totalCount)
      })
    },

    initPieChart() {
      // var data = [
      //   { value: 246, name: '待下发' },
      //   { value: 2, name: '处置中' },
      //   { value: 1, name: '已完成' },
      // ]
      var data=this.pieData;

      var option = {
        tooltip: {
          trigger: 'item',
          formatter: '{a} <br/>{b}: {c} ({d}%)',
        },
        color: ['#3F98FD', '#0BE3F5', '#FD9D73'],
        legend: {
          orient: 'vertical', //图例列表的布局朝向(垂直排列)
          left: '50%',
          y: 'center',
          itemGap: 30,
          itemWidth: 8,
          padding: 10,
          textStyle: {
            fontSize: 12,
            color: '#FFFFFF',
          },
          align: 'left',
          data: [
            // '待下发','处置中','已完成'
            {
              name: '待下发',
              icon: 'circle',
            },
            {
              name: '处置中',
              icon: 'circle',
            },
            {
              name: '已完成',
              icon: 'circle',
            },
          ],
          formatter: function (name) {
            var total = 0
            var target
            for (var i = 0, l = data.length; i < l; i++) {
              // total += data[i].value
              if (data[i].name == name) {
                target = data[i].value
              }
            }
            var arr = ['{a|' + name + ' :}{b|' + target + '}{a|个}']
            return arr.join('\n')
          },
          textStyle: {
            rich: {
              a: {
                fontSize: 14,
                fontFamily: 'Microsoft YaHei',
                fontWeight: 400,
                color: '#FFFFFF',
                align: 'left',
                padding: [0, 0, 0, 10],
              },
              b: {
                fontSize: 26,
                fontFamily: 'DIN',
                fontWeight: 'bold',
                color: '#3F98FD',
                align: 'right',
                padding: [0, 0, 0, 10],
                lineHeight: 25,
              },
              c: {
                fontSize: 26,
                fontFamily: 'DIN',
                fontWeight: 'bold',
                color: '#7BDBFF',
              },
              d: {
                fontSize: 16,
                fontFamily: 'Microsoft YaHei',
                fontWeight: '400',
                color: '#7BDBFF',
              },
            },
          },
        },
        series: [
          {
            name: '访问来源',
            type: 'pie',
            radius: ['35%', '50%'],
            center: ['27%', '51%'],
            avoidLabelOverlap: false,
            label: {
              show: true,
              position: 'center',
              formatter: '{c|'+this.totalCount+'} \n {d|工单总数}',
              textStyle: {
                rich: {
                  c: {
                    fontSize: 26,
                    fontFamily: 'DIN',
                    fontWeight: 'bold',
                    color: '#7BDBFF',
                  },
                  d: {
                    fontSize: 16,
                    fontFamily: 'Microsoft YaHei',
                    fontWeight: '400',
                    color: '#7BDBFF',
                  },
                },
              },
            },
            labelLine: {
              show: false,
            },
            data: this.pieData
            //
            // data: [
            //   { value: 1048, name: '待下发' },
            //   { value: 735, name: '处置中' },
            //   { value: 580, name: '已完成' },
            // ],
          },
        ],
      }
      var pieChart = echarts.init(document.getElementById('pieChart'))
      pieChart.setOption(option)
      let listener= function () {
        pieChart.resize()
       }
      window.addEventListener('resize', listener)


    var that = this;
    pieChart.on('legendselectchanged', function(obj) {
        // var selected = obj.selected;
        var legend = obj.name;

        if(legend == '待下发'){
          that.$router.push('/modules/order/AlarmOrderListPlus')
        }
        else if(legend == '处置中'){
          that.$router.push('/modules/order/AlarmOrderOngoingList')
        }else{
          that.$router.push('/modules/order/AlarmOrderCompleteList')
        }
    })

    pieChart.on('click', 'series.pie.label', function () {
        that.$router.push('/dashboard/analysis')
    });
    },
  },
}
</script>
<style lang='less' scoped>
.repair-order {
  .pie-chart {
    height: 100%;
    width: 100%;
  }
}
img{
  display: inline-block;
  height: auto;
  max-width: 100%;
}
</style>
