

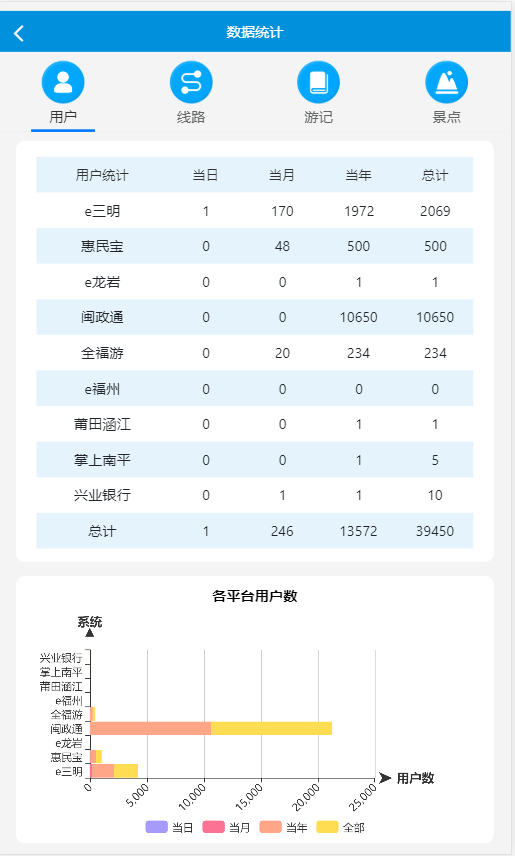
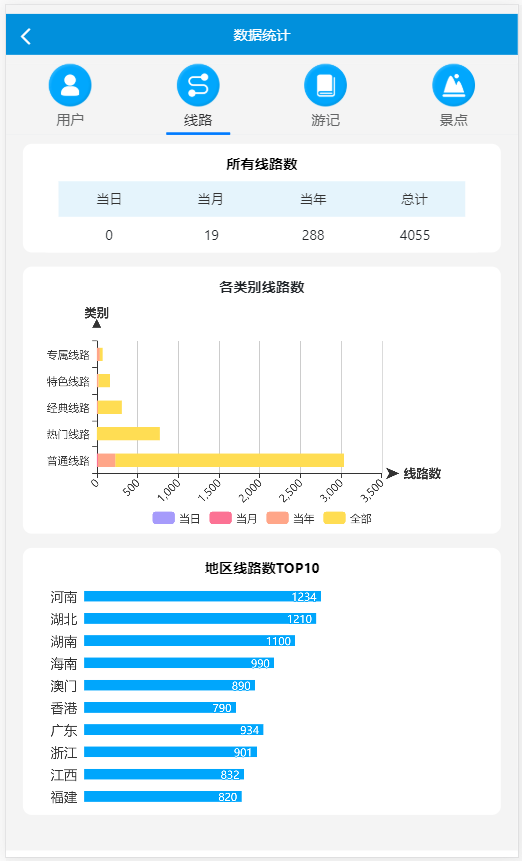
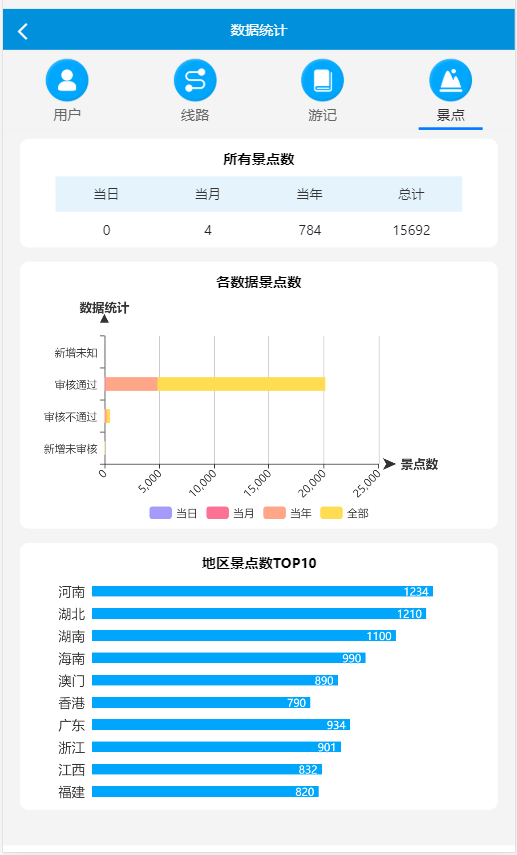
echarts-----父页面调用封装的echarts与表格子组件实例
页面tab切换的效果图:

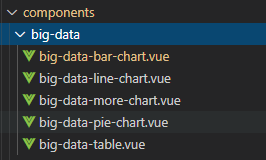
子组件结构:
父页面:
子组件代码:
big-data-bar-chart.vue代码如下:
<template>
  <!-- <div class="data-route-route-chart" id="routeChart"></div> 父类中会重新渲染样式,这里可以不用定义样式-->
  <div ref="bar" ></div>   <!-- 在父组件中需要多次用到该图表子组件,该图表子组件要用ref来绑定echarts,用id绑定会有:用到该组件的多个图表中各数据一致问题-->
</template>
<script>
export default {
  name: "big-data-bar-chart",
  data() {
    return {};
  },
  props: {
    value: {
      default: true
    }
  },
  mounted() {
   // debugger;
 //   console.log("xxxx" + this.value);
  },
  created() {},
  methods: {
    handleRouteChart() {
      var msg = this.value;
      // var routeChart = this.$echarts.init(
      //   document.getElementById("msg[msg.length-1]")
      // );.
      var routeChart = this.$echarts.init(this.$refs.bar)
      routeChart.setOption({
        // title: {
        //   text: msg[4],
        //   x: "center",
        //   top: 10,
        //   textStyle: {
        //     fontWeight: 550,
        //     color: "black",
        //     fontSize: 17
        //   }
        // },
        tooltip: {
          trigger: "axis",
          axisPointer: {
            // 坐标轴指示器,坐标轴触发有效
            type: "shadow" // 默认为直线,可选为:'line' | 'shadow'
          }
        },
        color: ["#A69BFB", "#FC7294", "#FFA689", "#FFDD53"],
        legend: {
          bottom: "3%",
          data: ["当日", "当月", "当年", "全部"]
        },
        grid: {
          //设置图表的上下左右边距
          left: "5%",
          right: "25%",
          top: "16%",
          bottom: "12%",
          containLabel: true
        },
        xAxis: {
          type: "value",
          name: msg[5],
          // max: 260,
          // splitNumber:5,//5等分
          nameTextStyle: {
            fontWeight: 1000,
            fontSize: 14,
            padding: 10
          },
          axisLine: {
            symbol: ["none", "arrow"],
            symbolOffset: 20
            // symbolSize:[35,38]
          },
         axisLabel: {
           interval:'auto',//0代表显示所有x轴标签显示,auto:表示自动根据刻度个数和宽度自动设置间隔个数
           rotate:45//逆时针旋转45度
          }
        },
        yAxis: {
          type: "category",
          name: msg[6],
          nameTextStyle: {
            fontWeight: 1000,
            fontSize: 14,
            padding: 10
          },
          axisLine: {
            symbolOffset: 20,
            symbol: ["none", "path://M250 150 L150 350 L350 350 Z"]
          },
          data: msg[7]
        },
        series: [
          {
            name: "当日",
            type: "bar",
            stack: "总量",
            label: {
              show: false
              //position: "insideRight"
            },
            //设置柱的宽度
            barWidth: 15,
            data: msg[0]
          },
          {
            name: "当月",
            type: "bar",
            stack: "总量",
            label: {
              show: false
              // position: "insideRight"
            },
            data: msg[1]
          },
          {
            name: "当年",
            type: "bar",
            stack: "总量",
            label: {
              show: false
              //position: "insideRight"
            },
            data: msg[2]
          },
          {
            name: "全部",
            type: "bar",
            stack: "总量",
            label: {
              show: false
              // position: "insideRight"
            },
            data: msg[3]
          }
        ]
      });
      //自适应div大小
      window.addEventListener("resize", function() {
      routeChart.resize();
    });
    }

  },

  watch: {
    $route: function(to, from) {}
  },
  mounted() {
    setTimeout(() => {
          this.handleRouteChart(this.value);
        }, 300);

   // this.handleRouteChart(this.value);
     //debugger;
//    console.log("pieData:" + JSON.stringify(this.value));
    //自适应div大小
    // window.addEventListener("resize", function() {
    //   routeChart.resize();
    // });
  }
};
</script>

<style scoped>
</style>
big-data-line-chart.vue代码如下:
<template>
  <!-- <div  class="data-route-add-charts" id="lineChart"></div> -->
  <div  class="data-route-add-charts" ref="line"></div>
</template>
<script>
 export default {
  name: "big-data-line-chart",
   data() {
    return {

    };
  },
   mounted() {},
  created() { },
  methods: {


    //各类别线路数增长echart
    handleLineCharts() {
      //var lineChart = this.$echarts.init(document.getElementById("lineChart"));
      var lineChart = this.$echarts.init(this.$refs.line)
      lineChart.setOption({
        color: ["#F336A0", "#5B9EE2", "#87EC10", "#FFDD53", "#6169F2"],

        tooltip: {
          trigger: "axis"
        },
        legend:

          {
            // orient: 'vertical', 图列纵向布局,默认为横向
            top: "81%",
            data: ["特色线路", "经典线路", "热门线路", "普通线路", "专属线路"]
          },
        grid: {
          top: "20%",
          bottom: "33%",
          left: "20%",
          right: "20%"
        },
        xAxis: [
          {
            type: "category",
            name: "年份",
            nameTextStyle: {
              fontWeight: 700,
              fontSize: 14
              // padding:10
            },
            axisLine: {
              symbolOffset: 20
            },
            boundaryGap: false,
            data: ["2015", "2016", "2017", "2018", "2019", "2020"]
          }
        ],
        yAxis: {
          type: "value",
          name: "线路数",
          nameTextStyle: {
            fontWeight: 700,
            fontSize: 14
            // padding:10
          },
          axisLine: {
            symbolOffset: 20
          },
          axisLabel: {
            fontSize: 16,
            formatter: function(value, index) {
              var value;
              if (value >= 1000) {
                value = value / 1000 + "k";
              } else if (value < 1000) {
                value = value;
              }
              return value;
            }
          }
        },
        series: [
          {
            name: "特色线路",
            type: "line",
            smooth: true,
            label: {
              show: false,
              position: "insideRight"
            },
            data: [99, 299, 99, 949, 1099, 2299, 1499]
          },
          {
            name: "经典线路",
            type: "line",
            smooth: true,
            label: {
              show: false,
              position: "insideRight"
            },
            data: [499, 699, 399, 949, 1599, 1999, 2499]
          },
          {
            name: "热门线路",
            type: "line",
            smooth: true,
            label: {
              show: false,
              position: "insideRight"
            },
            data: [820, 932, 901, 934, 1290, 1330, 1320]
          },
          {
            name: "普通线路",
            type: "line",
            smooth: true,
            label: {
              show: false,
              position: "insideRight"
            },
            data: [1020, 1132, 1001, 1134, 1490, 1630, 1720]
          },
          {
            name: "专属线路",
            type: "line",
            smooth: true,
            label: {
              show: false,
              position: "insideRight"
            },
            data: [70, 120, 524, 634, 690, 730, 720]
          }
        ]
      });
      //自适应div大小
      window.addEventListener("resize", function() {
      routeChart.resize();
    });
    },

  },

  watch: {
    $route: function(to, from) {

    }
  },
  mounted() {

      this.handleLineCharts();
    //自适应div大小
    // window.addEventListener("resize", function() {

    //    lineChart.resize();
    // });
  }
};
</script>

<style scoped>
</style>
big-data-more-chart.vue代码如下:
<template>
  <!-- <div  class="" style="width:100%;height:300px" id="more"></div> -->
  <div  ref="more"></div>
</template>
<script>
 export default {
  name: "big-data-more-chart",
   data() {
    return {

    };
  },
   mounted() {},
  created() { },
  methods: {

    //圆饼图表
    handleMoreCharts() {
      // var moreChart = this.$echarts.init(document.getElementById("more"));
      var moreChart = this.$echarts.init(this.$refs.more)
      moreChart.setOption({
        // title: {
        //   text: "地区线路数TOP10",
        //   x: "center",
        //   top: 5,
        //   textStyle: {
        //     color: "black",
        //     fontSize: 15
        //   }
        // },
        tooltip: {
          trigger: "axis",
          axisPointer: {
            // 坐标轴指示器,坐标轴触发有效
            type: "shadow" // 默认为直线,可选为:'line' | 'shadow'
          }
        },
        legend: {
           top: '0%',
          data: [
            "福建",
            "江西",
            "浙江",
            "广东",
            "香港",
            "澳门",
            "海南",
            "湖南",
            "湖北",
            "河南"
          ]
        },
        grid: {
          left: "8%",
          right: "4%",
          bottom: "0%",
           top: '0%',//去掉标题,图表整体往上移动
          containLabel: true
        },
        xAxis: {
          type: "value",
          show: false,
          bottom: 2
        },
        yAxis: {
          axisLabel: {
            fontSize: 15
          },

          type: "category",
          data: [
            "福建",
            "江西",
            "浙江",
            "广东",
            "香港",
            "澳门",
            "海南",
            "湖南",
            "湖北",
            "河南"
          ],
          axisTick: {
            //y轴刻度线
            show: false
          },
          axisLine: {
            //y轴
            show: false
          }
          // max: 10,
          // min: 1,
          // splitNumber: 10,
          //  boundaryGap:[0.2,0.2]
        },
        series: [
          {
            name: "景点数",
            top: 10,

            color: "#00A6FC",
            type: "bar",
            stack: "总量",
            barCategoryGap: 2,
            label: {
              show: true,
              textStyle: {
                fontWeight: 500,
                fontSize: 12
              },
              position: "insideRight"
            },
            //设置柱的宽度
            barWidth: 12,
            //  height:'70%',
            data: [820, 832, 901, 934, 790, 890, 990, 1100, 1210, 1234]
          }
        ]
      });
      //自适应div大小
      window.addEventListener("resize", function() {
      routeChart.resize();
    });
    }

  },

  watch: {
    $route: function(to, from) {

    }
  },
  mounted() {

      this.handleMoreCharts();
    //自适应div大小
    // window.addEventListener("resize", function() {

    //    moreChart.resize();
    // });
  }
}

</script>

<style scoped>

.data-spot-ranking{
        background: rgba(255, 255, 255, 1);
        height: 300px;
        width: 93.33%;
        margin: auto;
        border-radius: 10px ;
        text-align: center;
        margin-top: 16px;
        margin-bottom: 20px;


    }
</style>
big-data-pie-chart.vue代码如下:
<template>
  <!-- <div  class="" id="pieChart"></div> -->
  <div  class="" ref="pie"></div>
</template>
<script>
 export default {
  name: "big-data-pie-chart",
   data() {
    return {

    };
  },
   mounted() {},
  created() { },
  methods: {


    //圆饼图表
    handleInitPieCharts() {
      //var pieChart = this.$echarts.init(document.getElementById("pieChart"));
      var pieChart = this.$echarts.init(this.$refs.pie)
      pieChart.setOption({
        title: {
          text: "各天数线路比例",
          x: "center",
          top: 5,
          textStyle: {
            color: "black",
            fontSize: 15
          }
        },
        tooltip: {
          trigger: "item",
          formatter: "{a} <br/>{b}: {c} ({d}%)"
        },
        color: [
          "#E15D68",
          "#B466CA",
          "#428BD5",
          "#00CCCD",
          "#93EF8A",
          "#EFE08A",
          "#F29961"
        ],
        legend: {
          //设置左侧数据的样式
          orient: "vertical",
          // right: 200,
          left: 30,
          top: 30,
          itemWidth: 10,
          itemHeight: 5,
          formatter: "{name}",
          textStyle: {
            fontWeight: 500,
            fontSize: 12

            // color: '#FFFFFF'
          },
          data: [
            "生态文化",
            "历史文化",
            "宗教文化",
            "红色文化",
            "书院文化",
            "朱子文化",
            "其他"
          ]
        },
        series: [
          {
            name: "景点比例",
            type: "pie",
            x: "left",
            left: 70,
            top: 20,
            // left: -400,
            // radius: ["30%", "60%"],
            radius: ["25%", "80%"],
            avoidLabelOverlap: false,
            label: {
              normal: {
                position: "inner", //标签的,设置在饼;里面位置
                formatter: "{d}%",
                textStyle: {
                  fontWeight: "normal",
                  fontSize: 10
                }
              }
            },
            emphasis: {
              label: {
                show: true,
                fontSize: "13",
                fontWeight: "bold"
                // formatter: '{b}: {c}({d}%)' //自定义显示格式(b:name, c:value, d:百分比)
              }
            },
            labelLine: {
              show: false
            },
            formatter: "{d}%",
            data: [
              { value: 335, name: "生态文化" },
              { value: 310, name: "历史文化" },
              { value: 234, name: "宗教文化" },
              { value: 135, name: "红色文化" },
              { value: 154, name: "书院文化" },
              { value: 335, name: "朱子文化" },
              { value: 310, name: "其他" }
            ]
          }
        ]
      });
      //自适应div大小
    window.addEventListener("resize", function() {

       pieChart.resize();
    });
    },

  },

  watch: {
    $route: function(to, from) {

    }
  },
  mounted() {

      this.handleInitPieCharts();
    //自适应div大小
    // window.addEventListener("resize", function() {

    //    pieChart.resize();
    // });
  }
};
</script>

<style scoped>
</style>
big-data-table.vue代码如下:
<template>
  <div class="data-route-number">
    <!-- <p class="data-route-number-tittle" id="tittle">{{value.tittle}}</p> -->

    <div class="data-route-number-head">
      <van-row type="flex" justify="space-around">
        <van-col span="4">
          <p class="data-route-number-head-font">当日</p>
        </van-col>
        <van-col span="4">
          <p class="data-route-number-head-font">当月</p>
        </van-col>
        <van-col span="4">
          <p class="data-route-number-head-font">当年</p>
        </van-col>
        <van-col span="4">
          <p class="data-route-number-head-font">总计</p>
        </van-col>
      </van-row>
    </div>
    <div class="data-route-number-body">
      <van-row type="flex" justify="space-around">
        <van-col span="4">
          <p class="data-route-number-body-font">{{value.dayCount}}</p>
        </van-col>
        <van-col span="4">
          <p class="data-route-number-body-font">{{value.monthCount}}</p>
        </van-col>
        <van-col span="4">
          <p class="data-route-number-body-font">{{value.yearCount}}</p>
        </van-col>
        <van-col span="4">
          <p class="data-route-number-body-font">{{value.totalCount}}</p>
        </van-col>
      </van-row>
    </div>
  </div>
  <!-- <div></div> -->
</template>
<script>
//require("../../styles/big-data/data-total.scss");

export default {
  name: "big-data-table",
  data() {
    return {
      dayCount: 99,
      monthCount: 99,
      yearCount: 99,
      totalCount: 99,
      sonmsg: "这是子组件的数据",
      msg: []
    };
  },
  props: {
    value: {
      default: true
    }
  },
  components: {},
  methods: {

  },
  mounted() {
   //debugger;
   // console.log(this.value);
    //debugger;
  },
  created() {}
};
</script>
<style scoped>

.data-route-number-head{
    color: rgba(51, 51, 51, 1);
            line-height: 24px;
            width: 85%;
            height: 26.63%;
            font-size: 15px;
            margin: auto;
            background: rgba(229, 244, 252, 1);
}
.data-route-number-body{
            width: 85%;
            height: 23.97%;
            margin: auto;


        }
        .data-route-number-head-font{
                margin-top: 0.5rem;
                margin-bottom: 0.5rem;
            }
        .data-route-number-body-font{
                margin-top: 0.5rem;
                    margin-bottom: 0.5rem;
            }
</style>
父页面代码如下:
<template> <div class="data-all"> <van-sticky> <bs-top v-model="config.optionsTop"> <template slot="title">数据统计</template> </bs-top> </van-sticky> <van-tabs v-model="activeName" class="data-route-tabs"> <van-tab class="aa" name="a" v-show="$app.debug===true"> <template slot="title" class="data-route-tabs"> <van-image :src="`${$app.url.icons}/data/yonhu.png`" width="48" height="48" /> <p class="data-route-icon-font">用户</p> </template> <bs-list :filter="{}" :meta="{module:'big-data-user',field:'statistics'}" ref="refId" content-class @on-data-after="doResult" > <template slot="data" slot-scope="slot"> <div class="data-user-item"> <div class="data-user-item-number"> <p class="data-user-item-number-tittle"></p> <div class="data-user-item-number-head"> <van-row type="flex" justify="space-around"> <van-col span="6"> <p class="data-user-item-number-head-font">用户统计</p> </van-col> <van-col span="3"> <p class="data-user-item-number-head-font">当日</p> </van-col> <van-col span="3"> <p class="data-user-item-number-head-font">当月</p> </van-col> <van-col span="3"> <p class="data-user-item-number-head-font">当年</p> </van-col> <van-col span="3"> <p class="data-user-item-number-head-font">总计</p> </van-col> </van-row> </div> <div class="data-user-item-number-body"> <div v-for="(item, index) in slot.data" :key="index" > <van-row type="flex" justify="space-around" v-if="index%2===0" class="data-user-item-number-body-line" > <van-col span="6"> <p class="data-user-item-number-body-line-p" >{{item.name}}</p> </van-col> <van-col span="3"> <p class="data-user-item-number-body-line-p" >{{item.dayCount}}</p> </van-col> <van-col span="3"> <p class="data-user-item-number-body-line-p" >{{item.monthCount}}</p> </van-col> <van-col span="3"> <p class="data-user-item-number-body-line-p" >{{item.yearCount}}</p> </van-col> <van-col span="3"> <p class="data-user-item-number-body-line-p" >{{item.totalCount}}</p> </van-col> </van-row> <van-row type="flex" justify="space-around" v-else class="data-user-item-number-body-bgcolors data-user-item-number-body-line"> <van-col span="6"> <p class="data-user-item-number-body-line-p">{{item.name}}</p> </van-col> <van-col span="3"> <p class="data-user-item-number-body-line-p">{{item.dayCount}}</p> </van-col> <van-col span="3"> <p class="data-user-item-number-body-line-p">{{item.monthCount}}</p> </van-col> <van-col span="3"> <p class="data-user-item-number-body-line-p">{{item.yearCount}}</p> </van-col> <van-col span="3"> <p class="data-user-item-number-body-line-p">{{item.totalCount}}</p> </van-col> </van-row> </div> </div> </div> <div class="data-user-item-user"> <p class="data-user-item-user-tittle">各平台用户数</p> <big-data-bar-chart class="data-user-item-user-charts" v-model="userData" ></big-data-bar-chart> </div> <!-- <div class="data-user-item-add"> <p class="data-user-item-add-tittle">各平台用户数增长</p> <div class="data-user-item-add-heads"> <van-row type="flex" justify="center"> <van-col span="6" class="data-user-item-add-heads-false" :class="active===0? 'active':''" @click="handleClick(0)" >年增长</van-col> <van-col span="6" class="data-user-item-add-heads-false" :class="active===1? 'active':''" @click="handleClick(1)" >月增长</van-col> <van-col span="6" class="data-user-item-add-heads-false" :class="active===2? 'active':''" @click="handleClick(2)" >日增长</van-col> </van-row> </div> <div class="data-user-item-add-charts" id="lineChart"></div>注释掉 <big-data-line-chart style="width:100%;height:240px" id="userLine"></big-data-line-chart> </div> <div class="data-user-item-proportion"> <big-data-pie-chart style="width:100%;height:196px" id="userPie"></big-data-pie-chart> </div> <div class="data-user-item-ranking"> <big-data-more-chart class="data-user-item-ranking-charts" style="width:100%;height:240px" id="barChart"></big-data-more-chart> 注释掉 <big-data-more-chart id="userMore"></big-data-more-chart> </div>--> </div> </template> </bs-list> </van-tab> <van-tab name="b" v-show="$app.debug===true"> <template slot="title"> <van-image :src="`${$app.url.icons}/data/xianlu.png`" width="48" height="48" /> <p class="data-route-icon-font">线路</p> </template> <bs-list :filter="{}" :meta="{module:'big-data-route',field:'statistics'}" ref="refId" content-class @on-data-after="routeResult" > <template slot="data" slot-scope="slot"> <div class="data-route"> <div class="data-route-number"> <p class="data-route-number-tittle">所有线路数</p> <big-data-table id="tittle" v-model="slot.data[slot.data.length-1]"></big-data-table> </div> <div class="data-route-route"> <p class="data-route-route-tittle">各类别线路数</p> <!-- <big-data-bar-chart style="width:100%;height:300px" id="routeChart"></big-data-bar-chart> --> <big-data-bar-chart class="data-route-route-chart" id="routeBar" v-model="routeData"></big-data-bar-chart> </div> <!-- <div class="data-route-add"> <p class="data-route-add-tittle">各类别线路数增长</p> <div class="data-route-add-heads"> <van-row type="flex" justify="center"> <van-col span="6" class="data-route-add-heads-false" :class="selected===0? 'active':''" @click="handleRoute(0)" >年增长</van-col> <van-col span="6" class="data-route-add-heads-false" :class="selected===1? 'active':''" @click="handleRoute(1)" >月增长</van-col> <van-col span="6" class="data-route-add-heads-false" :class="selected===2? 'active':''" @click="handleRoute(2)" >日增长</van-col> </van-row> </div> <big-data-line-chart id="routeLine" class="data-route-add-charts"></big-data-line-chart> </div> <div class="data-route-proportion"> <big-data-pie-chart class="data-route-proportion-charts" id="routePie"></big-data-pie-chart> </div> --> <div class="data-route-ranking"> <p class="data-route-ranking-tittle">地区线路数TOP10</p> <big-data-more-chart id="routeMore" class="data-route-ranking-charts"></big-data-more-chart> </div> </div> </template> </bs-list> </van-tab> <van-tab name="c" v-show="$app.debug===true"> <template slot="title"> <van-image :src="`${$app.url.icons}/data/youji.png`" width="48" height="48" /> <p class="data-route-icon-font">游记</p> </template> <bs-list :filter="{}" :meta="{module:'big-data-note',field:'statistics'}" ref="refId" content-class > <template slot="data" slot-scope="slot"> <div class="data-travel"> <div class="data-travel-number"> <p class="data-travel-number-tittle">所有游记数</p> <big-data-table id="tittle" v-model="slot.data[slot.data.length-1]"></big-data-table> </div> <div class="data-travel-add"> <p class="data-travel-add-tittle">各天数游记增长图</p> <div class="data-travel-add-heads"> <van-row type="flex" justify="center"> <van-col span="6" class="data-travel-add-heads-false" :class="isActive===0? 'active':''" @click="handleTravel(0)" >年增长</van-col> <van-col span="6" class="data-travel-add-heads-false" :class="isActive===1? 'active':''" @click="handleTravel(1)" >月增长</van-col> <van-col span="6" class="data-travel-add-heads-false" :class="isActive===2? 'active':''" @click="handleTravel(2)" >日增长</van-col> </van-row> </div> <big-data-line-chart id="travelLine" style="width:100%;height:240px"></big-data-line-chart> </div> <div class="data-travel-proportion"> <big-data-pie-chart class="data-travel-proportion-charts" id="travelPie"></big-data-pie-chart> </div> <div class="data-travel-ranking"> <big-data-more-chart id="travelMore" class="data-travel-ranking-charts"></big-data-more-chart> </div> </div> </template> </bs-list> </van-tab> <van-tab name="d" v-show="$app.debug===true"> <template slot="title"> <van-image :src="`${$app.url.icons}/data/jingdian.png`" width="48" height="48" /> <p class="data-route-icon-font">景点</p> </template> <bs-list :filter="{}" :meta="{module:'big-data-dest',field:'statistics'}" ref="refId" content-class @on-data-after="spotResult" > <template slot="data" slot-scope="slot"> <div class="data-spot"> <div class="data-spot-number"> <p class="data-spot-number-tittle">所有景点数</p> <big-data-table id="tittle" class="data-spot-number-body" v-model="slot.data[slot.data.length-1]" ></big-data-table> </div> <div class="data-spot-item"> <p class="data-spot-item-tittle">各数据景点数</p> <big-data-bar-chart class="data-spot-item-charts" id="spotBar" v-model="spotData" ></big-data-bar-chart> </div> <!-- <div class="data-spot-proportion"> <big-data-pie-chart class="data-spot-proportion-charts" id="spotPie"></big-data-pie-chart> </div> --> <div class="data-spot-ranking"> <p class="data-spot-ranking-tittle">地区景点数TOP10</p> <big-data-more-chart class="data-spot-ranking-charts" id="spotBar"></big-data-more-chart> </div> </div> </template> </bs-list> </van-tab> </van-tabs> </div> </template> <script> require("../../styles/big-data/data-all.scss"); export default { data() { return { config: { optionsTop: { navBar: { "left-arrow": true } } }, options: {}, active: 0, isActive: 0, selected: 0, yearData: ["2015", "2016", "2017", "2018", "2019", "2020"], monthData: [ "1月", "2月", "3月", "4月", "5月", "6月", "7月", "8月", "9月", "10月", "11月", "12月" ], routeList: {}, dayList: [], monthList: [], yearList: [], totalList: [], nameList: [], activeName: "a", allData: [], userData: [], routeData: [], spotData: [], travelData: [] }; }, components: { "bs-top": () => import("../../components/bs-top"), PortalNavTop: () => import("../portal/nav-top"), PortalBsFooter: () => import("../portal/footer"), BsPageScroll: () => import("../../components/bs-page-scroll"), "bs-detail": () => import("../../components/bs-detail"), "bs-list": () => import("../../components/bs-list"), "bs-img": () => import("../../components/bs-img"), "big-data-bar-chart": () => import("../../components/big-data/big-data-bar-chart"), "big-data-line-chart": () => import("../../components/big-data/big-data-line-chart"), "big-data-pie-chart": () => import("../../components/big-data/big-data-pie-chart"), "big-data-more-chart": () => import("../../components/big-data/big-data-more-chart"), "big-data-table": () => import("../../components/big-data/big-data-table") }, created() { this.config.optionsTop.currentRouteId = this.$sessionGlobal.setPrevRoute( this.$route, this.$route.query._prevRouteId ).id; // this.config.areaList = this.$mainArea.getVantAreaList(); }, methods: { //用户页面的当日、当月、当年数据的切换 handleClick(value) { this.active = value; var lineChart = this.$echarts.init(document.getElementById("userLine")); if (value == 0) { //图表重绘、、数据清空、、图表切换 //lineChart.dispose(); //this.handleInitLineCharts(this.yearData); lineChart.setOption({ xAxis: { name: "年份" //data: this.monthData }, yAxis: { name: "人数", //data: this.monthData } }) } if (value == 1) { // lineChart.barwidth = 50 % lineChart.setOption({ xAxis: { name: "月份", data: this.monthData }, series: [ { name: "e三明", type: "line", data: [33, 31, 20, 35, 45, 47, 51, 57, 61, 70, 85, 45, 97] }, { name: "全福游", type: "line", data: [23, 21, 10, 25, 35, 37, 41, 47, 51, 60, 75, 35, 87] }, { name: "闽政通", type: "line", data: [43, 41, 50, 55, 45, 62, 75, 77, 61, 93, 85, 95, 111] }, { name: "e龙岩", type: "line", data: [17, 13, 19, 27, 22, 33, 55, 67, 42, 63, 81, 97, 103] }, { name: "惠民宝", type: "line", data: [37, 33, 29, 37, 32, 25, 35, 39, 42, 53, 81, 85, 83] }, { name: "莆田涵江", type: "line", data: [27, 33, 39, 37, 32, 43, 45, 57, 52, 67, 71, 85, 93] } ] }); } else { lineChart.setOption({ xAxis: { name: "日期" } }); } }, //线路页面的当日、当月、当年数据的切换 handleRoute(value) { this.active = value; var lineChart = this.$echarts.init(document.getElementById("routeLine")); if (value == 0) { lineChart.setOption({ xAxis: { name: "年份" //data: this.monthData }, yAxis: { name: "线路数", //data: this.monthData } }) } if (value == 1) { // lineChart.barwidth = 50 % lineChart.setOption({ xAxis: { name: "月份", data: this.monthData }, series: [ { name: "e三明", type: "line", data: [33, 31, 20, 35, 45, 47, 51, 57, 61, 70, 85, 45, 97] }, { name: "全福游", type: "line", data: [23, 21, 10, 25, 35, 37, 41, 47, 51, 60, 75, 35, 87] }, { name: "闽政通", type: "line", data: [43, 41, 50, 55, 45, 62, 75, 77, 61, 93, 85, 95, 111] }, { name: "e龙岩", type: "line", data: [17, 13, 19, 27, 22, 33, 55, 67, 42, 63, 81, 97, 103] }, { name: "惠民宝", type: "line", data: [37, 33, 29, 37, 32, 25, 35, 39, 42, 53, 81, 85, 83] }, { name: "莆田涵江", type: "line", data: [27, 33, 39, 37, 32, 43, 45, 57, 52, 67, 71, 85, 93] } ] }); } else { lineChart.setOption({ xAxis: { name: "日期" } }); } }, //游记页面的当日、当月、当年数据的切换 handleTravel(value) { this.active = value; var lineChart = this.$echarts.init( document.getElementById("travelLine") ); if (value == 0) { lineChart.setOption({ xAxis: { name: "年份" //data: this.monthData }, yAxis: { name: "游记数", //data: this.monthData } }) } if (value == 1) { // lineChart.barwidth = 50 % lineChart.setOption({ xAxis: { name: "月份", data: this.monthData }, series: [ { name: "e三明", type: "line", data: [33, 31, 20, 35, 45, 47, 51, 57, 61, 70, 85, 45, 97] }, { name: "全福游", type: "line", data: [23, 21, 10, 25, 35, 37, 41, 47, 51, 60, 75, 35, 87] }, { name: "闽政通", type: "line", data: [43, 41, 50, 55, 45, 62, 75, 77, 61, 93, 85, 95, 111] }, { name: "e龙岩", type: "line", data: [17, 13, 19, 27, 22, 33, 55, 67, 42, 63, 81, 97, 103] }, { name: "惠民宝", type: "line", data: [37, 33, 29, 37, 32, 25, 35, 39, 42, 53, 81, 85, 83] }, { name: "莆田涵江", type: "line", data: [27, 33, 39, 37, 32, 43, 45, 57, 52, 67, 71, 85, 93] } ] }); } else { lineChart.setOption({ xAxis: { name: "日期" } }); } }, doResult(item) { //向barchart子组件传值 //debugger; //console.log(item.data); this.userData = []; this.dayList = []; this.monthList = []; this.yearList = []; this.totalList = []; this.nameList = []; for (let i = 0; i < item.data.length - 1; i++) { let dayCount = (item.data[i].name, item.data[i].dayCount); let monthCount = (item.data[i].name, item.data[i].monthCount); let yearCount = (item.data[i].name, item.data[i].yearCount); let totalCount = (item.data[i].name, item.data[i].totalCount); //console.log("dayCount" + dayCount); //console.log("yearCount" + yearCount); this.dayList.push(dayCount); this.monthList.push(monthCount); this.yearList.push(yearCount); this.totalList.push(totalCount); this.nameList.push(item.data[i].name); } // this.userData.put("dayList", this.dayList); // this.userData.put("monthList", this.monthList); // this.userData.put("yearListt", this.yearList); // this.userData.put("totalList", this.totalList); // this.userData.put(("tittle", "各平台用户数")); this.userData.push(this.dayList); this.userData.push(this.monthList); this.userData.push(this.yearList); this.userData.push(this.totalList); this.userData.push("各平台用户数"); this.userData.push("用户数"); this.userData.push("系统"); this.userData.push(this.nameList); // this.userData = this.userData.concat([{dayList:this.dayList}]); // //this.userData.dayList=this.dayList; // this.userData = this.userData.concat([{monthList:this.monthList}]); // // this.userData.monthList=this.monthList; // this.userData = this.userData.concat([{yearList:this.yearList}]); // // this.userData = this.userData.concat([{yearList:[]}]); // // this.userData.yearList=this.yearList; // this.userData = this.userData.concat([{totalList:this.totalList}]); // //this.userData.totalList=this.totalList; // this.userData = this.userData.concat([{tittle:"各平台用户数"}]); // //this.userData.tittle="各平台用户数"; // this.userData = this.userData.concat([{xname:"用户数"}]); // this.userData = this.userData.concat([{yname:"系统"}]); // // this.userData.tittle="各平台用户数"; // console.log(this.userData); // setTimeout(() => { // this.handleRouteChart(); // }, 300); }, routeResult(item) { //向barchart子组件传值 // debugger; this.routeData = []; this.dayList = []; this.monthList = []; this.yearList = []; this.totalList = []; this.nameList = []; for (let i = 0; i < item.data.length - 1; i++) { let dayCount = (item.data[i].name, item.data[i].dayCount); let monthCount = (item.data[i].name, item.data[i].monthCount); let yearCount = (item.data[i].name, item.data[i].yearCount); let totalCount = (item.data[i].name, item.data[i].totalCount); //console.log("dayCount" + dayCount); // console.log("yearCount" + yearCount); this.dayList.push(dayCount); this.monthList.push(monthCount); this.yearList.push(yearCount); this.totalList.push(totalCount); this.nameList.push(item.data[i].name); } this.routeData.push(this.dayList); this.routeData.push(this.monthList); this.routeData.push(this.yearList); this.routeData.push(this.totalList); this.routeData.push("各类别线路数"); this.routeData.push("线路数"); this.routeData.push("类别"); this.routeData.push(this.nameList); // console.log(this.routeData); }, spotResult(item) { //向barchart子组件传值 this.routeData = []; this.dayList = []; this.monthList = []; this.yearList = []; this.totalList = []; this.nameList = []; for (let i = 0; i < item.data.length - 1; i++) { let dayCount = (item.data[i].name, item.data[i].dayCount); let monthCount = (item.data[i].name, item.data[i].monthCount); let yearCount = (item.data[i].name, item.data[i].yearCount); let totalCount = (item.data[i].name, item.data[i].totalCount); //console.log("dayCount" + dayCount); // console.log("yearCount" + yearCount); this.dayList.push(dayCount); this.monthList.push(monthCount); this.yearList.push(yearCount); this.totalList.push(totalCount); this.nameList.push(item.data[i].name); } this.spotData.push(this.dayList); this.spotData.push(this.monthList); this.spotData.push(this.yearList); this.spotData.push(this.totalList); this.spotData.push("各数据景点数"); this.spotData.push("景点数"); this.spotData.push("数据统计"); this.spotData.push(this.nameList); // console.log(this.spotData); }, //设置用户的初始圆饼图、排行图表的数据 pieResult(){ //初始化圆饼图数据 var routePie = this.$echarts.init(document.getElementById("routePie")); routePie.setOption({ title: { text: "各平台用户比例" }, legend: { data: [ "e三明", "e龙岩", "全福游", "惠民宝", "闽政通", "莆田涵江" ] }, series: [ { name: "用户点比例", data: [ { value: 335, name: "e三明" }, { value: 310, name: "e龙岩" }, { value: 234, name: "全福游" }, { value: 135, name: "惠民宝" }, { value: 154, name: "闽政通" }, { value: 335, name: "莆田涵江" } ] } ] }); 初始化排行图表数据 var userMore = this.$echarts.init(document.getElementById("userMore")); userMore.setOption({ title: { text: "各地区用户人数" } }) } }, watch: { $route: function(to, from) { // if (to !== undefined && to !== from && from.name === "portal-merc-page") { // this.filter.productAttr = ""; // } } }, mounted() { // setTimeout(() => { // this.pieResult(); // }, 600); } }; </script> <style scoped> </style>
<template>
<!-- <div class="" style="width:100%;height:300px" id="more"></div> -->
<div ref="more"></div>
</template>
<script>
export default {
name: "big-data-more-chart",
data() {
return {
};
},
mounted() {},
created() { },
methods: {
//圆饼图表
handleMoreCharts() {
// var moreChart = this.$echarts.init(document.getElementById("more"));
var moreChart = this.$echarts.init(this.$refs.more)
moreChart.setOption({
// title: {
// text: "地区线路数TOP10",
// x: "center",
// top: 5,
// textStyle: {
// color: "black",
// fontSize: 15
// }
// },
tooltip: {
trigger: "axis",
axisPointer: {
// 坐标轴指示器,坐标轴触发有效
type: "shadow" // 默认为直线,可选为:'line' | 'shadow'
}
},
legend: {
top: '0%',
data: [
"福建",
"江西",
"浙江",
"广东",
"香港",
"澳门",
"海南",
"湖南",
"湖北",
"河南"
]
},
grid: {
left: "8%",
right: "4%",
bottom: "0%",
top: '0%',//去掉标题,图表整体往上移动
containLabel: true
},
xAxis: {
type: "value",
show: false,
bottom: 2
},
yAxis: {
axisLabel: {
fontSize: 15
},
type: "category",
data: [
"福建",
"江西",
"浙江",
"广东",
"香港",
"澳门",
"海南",
"湖南",
"湖北",
"河南"
],
axisTick: {
//y轴刻度线
show: false
},
axisLine: {
//y轴
show: false
}
// max: 10,
// min: 1,
// splitNumber: 10,
// boundaryGap:[0.2,0.2]
},
series: [
{
name: "景点数",
top: 10,
color: "#00A6FC",
type: "bar",
stack: "总量",
barCategoryGap: 2,
label: {
show: true,
textStyle: {
fontWeight: 500,
fontSize: 12
},
position: "insideRight"
},
//设置柱的宽度
barWidth: 12,
// height:'70%',
data: [820, 832, 901, 934, 790, 890, 990, 1100, 1210, 1234]
}
]
});
//自适应div大小
window.addEventListener("resize", function() {
routeChart.resize();
});
}
},
watch: {
$route: function(to, from) {
}
},
mounted() {
this.handleMoreCharts();
//自适应div大小
// window.addEventListener("resize", function() {
// moreChart.resize();
// });
}
}
</script>
<style scoped>
.data-spot-ranking{
background: rgba(255, 255, 255, 1);
height: 300px;
width: 93.33%;
margin: auto;
border-radius: 10px ;
text-align: center;
margin-top: 16px;
margin-bottom: 20px;
}
</style>
