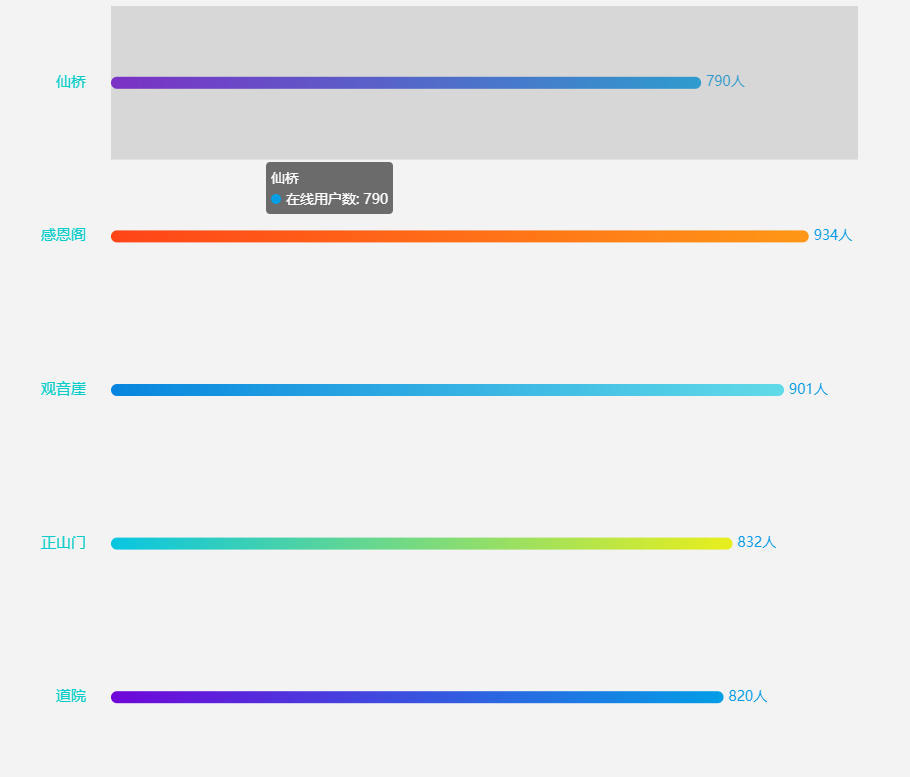
echarts-----渐变色横向柱状图

效果图:


代码如下:


option = {
                tooltip: {
                    trigger: "axis",
                    axisPointer: {
                        // 坐标轴指示器,坐标轴触发有效
                        type: "shadow" // 默认为直线,可选为:'line' | 'shadow'
                    }
                },

                grid: {
                    left: "4%",
                    right: "10%",
                    bottom: "0%",
                    top: '0%', //去掉标题,图表整体往上移动
                    containLabel: true
                },
                xAxis: {
                    type: "value",
                    show: false,//直接设置show|的属性的话x轴的轴线和垂直于它的网格线以及x轴数据会一起显示隐藏,这里需要全部隐藏包括所以直接show,如果需要单独给它们设置显示隐藏详见以下设置
                    // axisLine: {//y轴轴线
                    //     show: false
                    // },
                    // axisTick: {
                    //     //y轴刻度线
                    //     show: false
                    // },
                    // splitLine: {//去除网格线
                    //     show: false
                    // },
                    bottom: 2,
                    boundaryGap: ['0%', '1%'],//留白大小,坐标轴1边留白,横向柱状图的右侧label**人不会超出宽度被隐藏
                },
                yAxis: {
                    boundaryGap: ['0%', '1%'],//留白大小,坐标轴1边留白
                    axisLabel: {
                        fontSize: 15,
                        color: '#05CCCA',
                        interval: 0,
                        //margin: 95,
                        margin: 25,
                        //textStyle: {
                        //    align: 'left',
                        //    baseline: 'left'
                        //}
                    },
                    type: "category",
                    data: ['道院', '正山门', '观音崖', '感恩阁','仙桥'],
                    axisTick: {
                        //y轴刻度线
                        show: false
                    },
                    axisLine: {//y轴轴线
                        show: false
                    }

                },
                series: [{
                    name: "在线用户数",
                    top: 10,
                    color: "#00A6FC",
                    type: "bar",
                    stack: "总量",
                    barCategoryGap: 2,
                    itemStyle: {
                        //通常情况下:
                        normal: {

                            barBorderRadius: 8,
                            //每个柱子的颜色即为colorList数组里的每一项,如果柱子数目多于colorList的长度,则柱子颜色循环使用该数组
                            color: function (params) {
                                var colorList = [
                                    ['#039EE6', '#7006D9'],
                                    ['#E9EE1C', '#08C6E2'],
                                    ['#61dbe8', '#0785de'],
                                    ['#ff9717', '#ff4518'],
                                ];
                                var index = params.dataIndex;
                                if (params.dataIndex >= colorList.length) {
                                    index = params.dataIndex - colorList.length;
                                }
                                return new echarts.graphic.LinearGradient(1, 0, 0, 0, [{
                                    offset: 0,
                                    color: colorList[index][0]
                                },
                                {
                                    offset: 1,
                                    color: colorList[index][1]
                                }
                                ]);
                            }
                        },
                    },
                    label: {
                        formatter: "{c}人",
                        right: '3%',
                        show: true,
                        textStyle: {
                            fontWeight: 400,
                            fontSize: 14,
                            color: "#069AE6"
                        },
                        position: "right"
                    },
                    //设置柱的宽度
                    barWidth: 12,
                    //  height:'70%',
                    data: [820, 832, 901, 934, 790]
                    // data: countData
                }]
            }


posted @ 2020-10-16 15:10  逸凨  阅读(2091)  评论(0编辑  收藏  举报