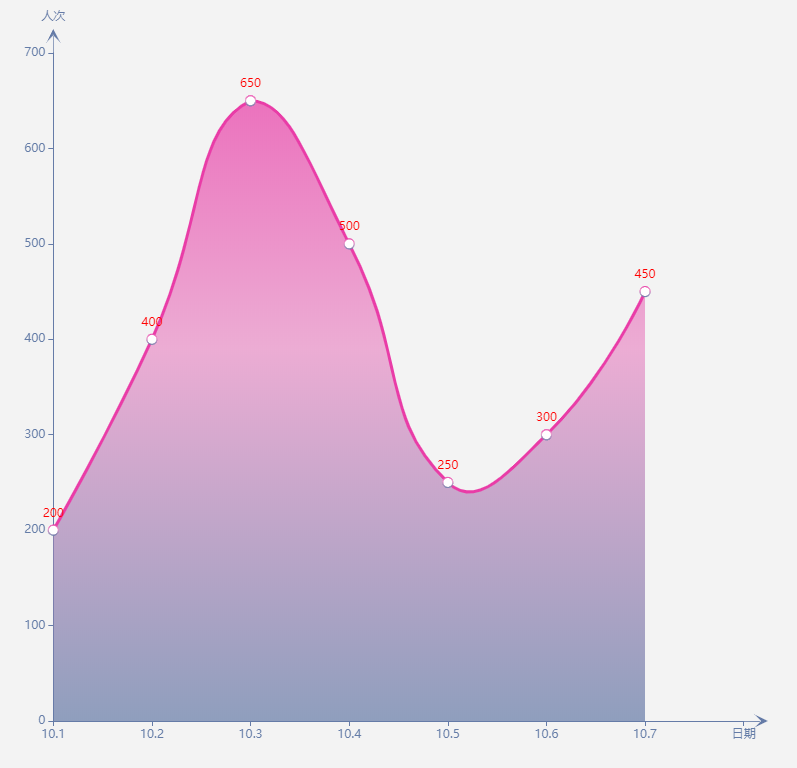
效果图如下
代码如下:
option = {
                xAxis: {
                    //name: '日期',//y轴名称
                    nameGap: 30,
                    type: 'category',
                    boundaryGap: false,
                    //设置x轴的刻度坐标展示数据,会覆盖series中数据的name属性【也是设置x轴的刻度坐标的展示数据,如果这里没有设置data,而x轴的刻度坐标没有展示数据的话,这里可以添加data进行覆盖展示】
                    // data: tendencyNameData,
                    axisLabel: {//x轴文本的样式
                        show: true,
                        textStyle: {
                            color: '#647CA7',
                            fontSize: '12',
                            left: '20'
                        }

                    },
                    axisLine: {//x轴的样式
                        //设置箭头方法一
                        // symbolOffset: 50,
                        // symbolSize: [35, 38],

                        // symbol: ['none', 'arrow'],    //只在末端显示箭头

                        //设置箭头方法二
                        symbol: ['none', 'path://M5, 20 L5, 5 L8, 8 L5, 2 L2, 8 L5, 5 L5.3, 6 L5.3,20'],
                        symbolOffset: 5,//箭头与轴线的间距
                        symbolSize: [35, 38],
                        lineStyle: {
                            color: '#657BA7'
                        }
                    }
                },
                yAxis: {
                    name: '人次',
                    nameGap: 30,
                    type: 'value',
                    splitLine: {//去除网格线
                        show: false
                    },
                    //boundaryGap: [0, '30%'],
                    axisLabel: {
                        show: true,
                        textStyle: {
                            color: '#647CA7',
                            fontSize: '12'
                        }
                    },
                    axisLine: {
                        //只在末端显示箭头,但是箭头的样式、箭头与轴线没有连线等不可调所以用以下方法
                        symbol: ['none', 'path://M5, 20 L5, 5 L8, 8 L5, 2 L2, 8 L5, 5 L5.3, 6 L5.3,20'],//绘制箭头
                        symbolOffset: 5,//箭头与轴线的间距
                        symbolSize: [35, 38],//箭头 大小

                        lineStyle: {
                            color: '#657BA7'
                        }
                    }
                },
                //设置渐变色需要去掉visualMap属性
                // visualMap: {
                //     type: 'piecewise',
                //     show: false,
                //     dimension: 0,
                //     seriesIndex: 0,
                //     // pieces: [{
                //     //     gt: 1,
                //     //     lt: 3,
                //     //     color: 'rgba(0, 180, 0, 0.5)'
                //     // }, {
                //     //     gt: 5,
                //     //     lt: 7,
                //     //     color: 'rgba(0, 180, 0, 0.5)'
                //     // }]
                // },
                series: [
                    {
                        type: 'line',
                        smooth: true,//折点处圆滑,即折线变为圆滑的曲线
                        // symbol: 'none',
                        // lineStyle: {
                        //     color: 'green',
                        //     width: 2
                        // },

                        itemStyle: {
                            normal: { //颜色渐变函数 前四个参数分别表示四个位置依次为左、下、右、上
                                color: new echarts.graphic.LinearGradient(0, 0, 0, 1, [{
                                    offset: 0, color: '#E93CA7' // 0% 处的颜色
                                }, {
                                    offset: 0.4, color: '#EA8FC7' // 100% 处的颜色
                                }, {
                                    offset: 1, color: '#657BA7' // 100% 处的颜色
                                }]
                                ), //背景渐变色
                                lineStyle: {        // 系列级个性化折线样式
                                    width: 3,
                                    type: 'solid',
                                    color: "#E93CA7" //折线的颜色
                                }
                            }
                        },//线条样式
                        symbolSize: 10, //折线点的大小
                        label: {
                            normal: {
                                show: true,
                                position: 'top',
                                textStyle: {
                                    color: 'red'
                                }
                            }
                        },
                        areaStyle: { normal: {} },
                        data: [
                            ['10.1', 200],
                            ['10.2', 400],
                            ['10.3', 650],
                            ['10.4', 500],
                            ['10.5', 250],
                            ['10.6', 300],
                            ['10.7', 450],
                            ['日期', null]
                        ]
                    }
                ]
            };

var tendencyWeekChart = echarts.init(document.getElementById("visitor"));
tendencyWeekChart.setOption(option);

//备注:图表自适应窗口的大小
window.addEventListener("resize", function () {
 tendencyWeekChart.resize();
});


