Echarts 在地图上绘制柱状图
首先需要获取地图JSON数据包,点此下载(Echarts官方地图数据,包含世界、中国,及国内各省数据)。
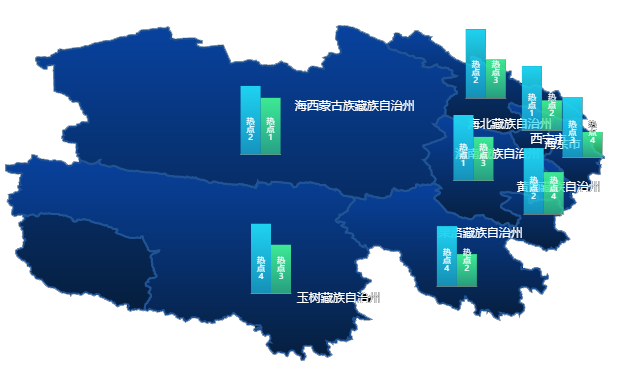
以青海省地图为例:
代码如下:

// 读取地图数据
$.getJSON('./mapjson/province/qinghai.json', function(qinghai)
{
    // 注册JSON数据地图至echarts
    echarts.registerMap('qinghai', qinghai);

    var myChart = echarts.init(document.getElementById('map'));
    myChart.showLoading(
    {
        text: '加载中...',
        color: '#c23531',
        fontSize: '28px',
        textColor: '#000',
        maskColor: 'rgba(255, 255, 255, 0.2)',
        zlevel: 0,
    });

    // 字体、柱图缩放倍数
    var scale = 1;

    // 柱状图数据
    var xData =
    {
        '西宁市': ['热点1', '热点2'],
        '海东市': ['热点3', '热点4'],
        '海北藏族自治州': ['热点2', '热点3'],
        '黄南藏族自治州': ['热点2', '热点4'],
        '海南藏族自治州': ['热点1', '热点3'],
        '果洛藏族自治州': ['热点4', '热点2'],
        '玉树藏族自治州': ['热点4', '热点3'],
        '海西蒙古族藏族自治州': ['热点2', '热点1'],
    };
    var rawData =
    {
        '西宁市': [92, 43],
        '海东市': [26, 11],
        '海北藏族自治州': [59, 33],
        '黄南藏族自治州': [66, 42],
        '海南藏族自治州': [75, 50],
        '果洛藏族自治州': [43, 23],
        '玉树藏族自治州': [10, 7],
        '海西蒙古族藏族自治州': [98, 81],
    };

    // 柱状图所在坐标,与rawData对应
    var coordData =
    {
        '西宁市': [101.178916, 38.423178],
        '海东市': [102.10327, 37.802916],
        '海北藏族自治州': [99.901059, 39.159435],
        '黄南藏族自治州': [101.219988, 36.517744],
        '海南藏族自治州': [99.619542, 37.280353],
        '果洛藏族自治州': [99.242143, 34.8736],
        '玉树藏族自治州': [95.008522, 34.704049],
        '海西蒙古族藏族自治州': [94.770785, 37.874663],
    };

    // 柱状图颜色
    var colorList = ['31 ,210, 240', '61, 233, 147'];

    // 地图配置
    var option =
    {
        geo:
        [
            {
                type: 'map',
                map: 'qinghai',
                aspectScale: 1, // 地图比例
                zoom: 1.25, // 地图缩放倍数
                label:
                {
                    // 地图字体,通常状态
                    normal:
                    {
                        show: true,
                        color:"#fff",
                        fontSize: 12 * scale,
                    },
                    // 地图字体,选中状态
                    emphasis:
                    {
                        show: true,
                        fontSize: 12 * scale,
                        color:"#fff"
                    }
                },
                itemStyle:
                {
                    // 地图区块样式,通常状态
                    normal:
                    {
                        areaColor:
                        {
                            x: 0, y: 0, x2: 0, y2: 1,
                            colorStops:
                            [
                                {
                                    offset: 0,
                                    color: '#08429F'
                                },
                                {
                                    offset: 1,
                                    color: '#061E3D'
                                },
                            ],
                        },
                        borderColor: '#215495',
                        borderWidth: 2 * scale,
                    },
                    // 地图区块样式,选中状态
                    emphasis:
                    {
                        areaColor:
                        {
                            x: 0, y: 0, x2: 0, y2: 1,
                            colorStops:
                            [
                                {
                                    offset: 0,
                                    color: '#084DBC'
                                },
                                {
                                    offset: 1,
                                    color: '#092F5E'
                                },
                            ],
                        },
                    }
                },
            },
        ]
    };

    myChart.hideLoading();
    myChart.setOption(option, true);
    myChart.resize();

    // 遍历省内所有地区,分别添加柱状图
    echarts.util.each(qinghai.features, function(dataItem, idx)
    {
        // 获取当前地区数据
        var thisXData = xData[dataItem.properties.name];
        var thisData = rawData[dataItem.properties.name];
        // 根据coordData中当前地区经纬度计算柱状图在图表内的对应坐标
        var coord = myChart.convertToPixel('geo', coordData[dataItem.properties.name]);

        // 生成柱状图数据
        var tmpOption =
        {
            xAxis : [],
            yAxis : [],
            grid : [],
            series : [],
            tooltip :
            {
                trigger: 'item',
                axisPointer:
                {
                    type: 'none'
                },
                textStyle:
                {
                    fontSize: 12 * scale,
                },
                formatter: function(params)
                {
                    var returnStr = '';
                    if(params.componentSubType == 'bar')
                    {
                        returnStr += params.marker + ' ';
                        returnStr += params.name + ':' + params.value;
                        returnStr += ' 项';
                    }

                    return returnStr;
                }
            }
        };

        // 生成柱状图x轴配置
        tmpOption.xAxis.push(
        {
            id: idx,
            gridId: idx,
            splitLine:
            {
                show: false
            },
            axisTick:
            {
                show: false
            },
            axisLabel:
            {
                show: false
            },
            data: thisXData,
            z: 100
        });

        // 生成柱状图y轴配置
        tmpOption.yAxis.push(
        {
            id: idx,
            gridId: idx,
            splitLine:
            {
                show: false
            },
            axisTick:
            {
                show: false
            },
            axisLabel:
            {
                show: false
            },
            z: 100
        });

        // 配置柱状图绘制大小、位置
        tmpOption.grid.push(
        {
            id: idx,
            width: 40 * scale,
            height: 70 * scale,
            left: coord[0],
            top: coord[1],
            z: 100
        });

        // 生成柱状图数据
        tmpOption.series.push(
        {
            id: idx,
            type: 'bar',
            xAxisId: idx,
            yAxisId: idx,
            barGap: 0,
            barCategoryGap: 0,
            data: thisData,
            z: 100,
            itemStyle:
            {
                normal:
                {
                    label:
                    {
                        show: true,
                        position: 'insideBottom',
                        textStyle:
                        {
                            color: '#fff',
                            fontSize: 8 * scale
                        },
                        formatter: function(params)
                        {
                            var txtArray = params.name.split('');
                            var rs = '';
                            for(var i = 0; i < txtArray.length; i++)
                            {
                                rs += txtArray[i] + "\n";
                            }

                            return rs;
                        }
                    },
                    color: function(params)
                    {
                        return new echarts.graphic.LinearGradient(
                            0, 0, 0, 1,
                            [
                                {
                                    offset: 0,
                                    color: 'rgba(' + colorList[params.dataIndex] + ', 1)'
                                },
                                {
                                    offset: 1,
                                    color: 'rgba(' + colorList[params.dataIndex] + ', 0.6)'
                                },
                            ], false);
                    }
                }
            }
        });

        myChart.setOption(tmpOption);
    });
})
欢迎转载,转载时请注明来源。


【推荐】国内首个AI IDE,深度理解中文开发场景,立即下载体验Trae
【推荐】编程新体验,更懂你的AI,立即体验豆包MarsCode编程助手
【推荐】抖音旗下AI助手豆包,你的智能百科全书,全免费不限次数
【推荐】轻量又高性能的 SSH 工具 IShell:AI 加持,快人一步
· 从 HTTP 原因短语缺失研究 HTTP/2 和 HTTP/3 的设计差异
· AI与.NET技术实操系列:向量存储与相似性搜索在 .NET 中的实现
· 基于Microsoft.Extensions.AI核心库实现RAG应用
· Linux系列:如何用heaptrack跟踪.NET程序的非托管内存泄露
· 开发者必知的日志记录最佳实践
· TypeScript + Deepseek 打造卜卦网站:技术与玄学的结合
· Manus的开源复刻OpenManus初探
· AI 智能体引爆开源社区「GitHub 热点速览」
· C#/.NET/.NET Core技术前沿周刊 | 第 29 期(2025年3.1-3.9)
· 从HTTP原因短语缺失研究HTTP/2和HTTP/3的设计差异