
[python]使用diagrams绘制架构图
简介
diagrams是python的一个第三方库,用于实现使用代码绘制架构图。
安装
依赖于 Graphviz,安装diagrams之前需要先安装 Graphviz(下载压缩包后,将bin目录添加到系统环境变量Path里即可)。
python3 -m pip install diagrams
快速入门
- main.py
from diagrams import Diagram
from diagrams.aws.compute import EC2
from diagrams.aws.database import RDS
from diagrams.aws.network import ELB
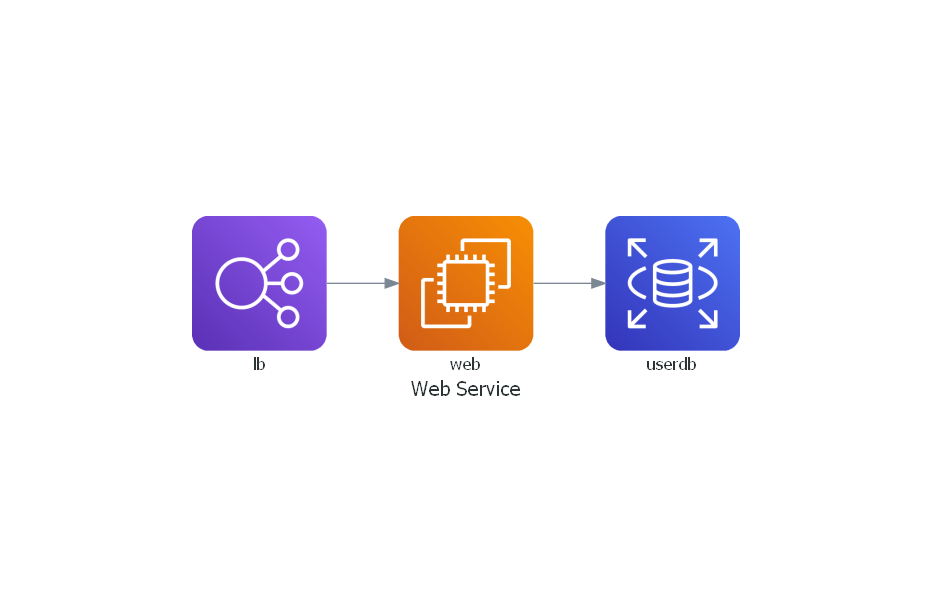
with Diagram("Web Service", show=False):
ELB("lb") >> EC2("web") >> RDS("userdb")
- 运行
python main.py
示例
简单的应用组
from diagrams import Diagram
from diagrams.aws.compute import EC2
from diagrams.aws.database import RDS
from diagrams.aws.network import ELB
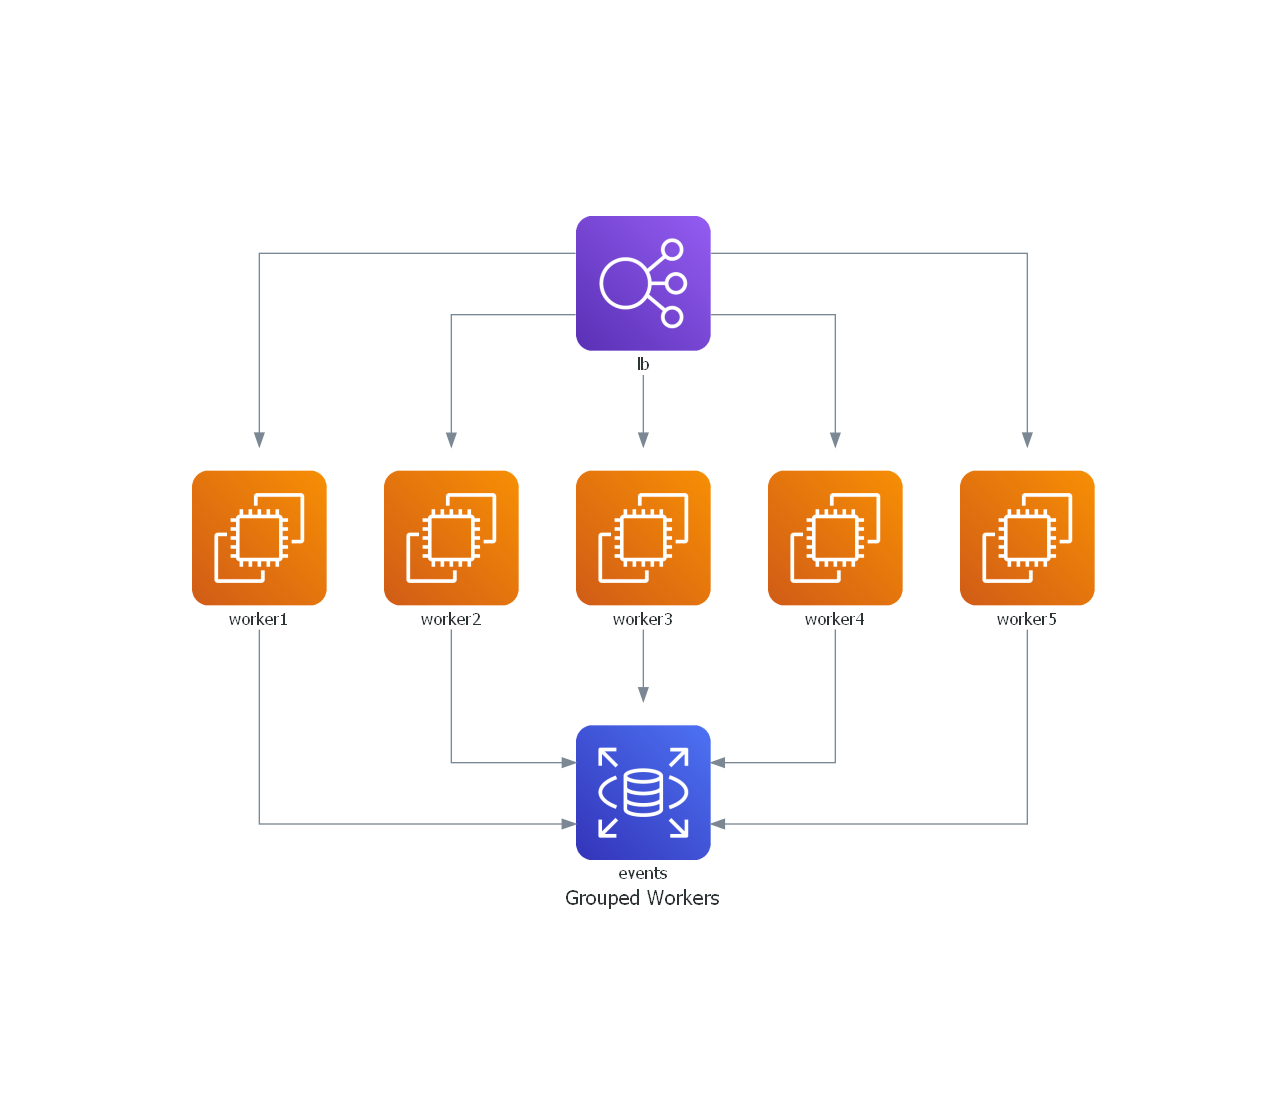
with Diagram("Grouped Workers", show=False, direction="TB"):
ELB("lb") >> [EC2("worker1"),
EC2("worker2"),
EC2("worker3"),
EC2("worker4"),
EC2("worker5")] >> RDS("events")
web 服务集群
from diagrams import Cluster, Diagram
from diagrams.aws.compute import ECS
from diagrams.aws.database import ElastiCache, RDS
from diagrams.aws.network import ELB
from diagrams.aws.network import Route53
graph_attr = {
"bgcolor": "transparent" # 透明背景
}
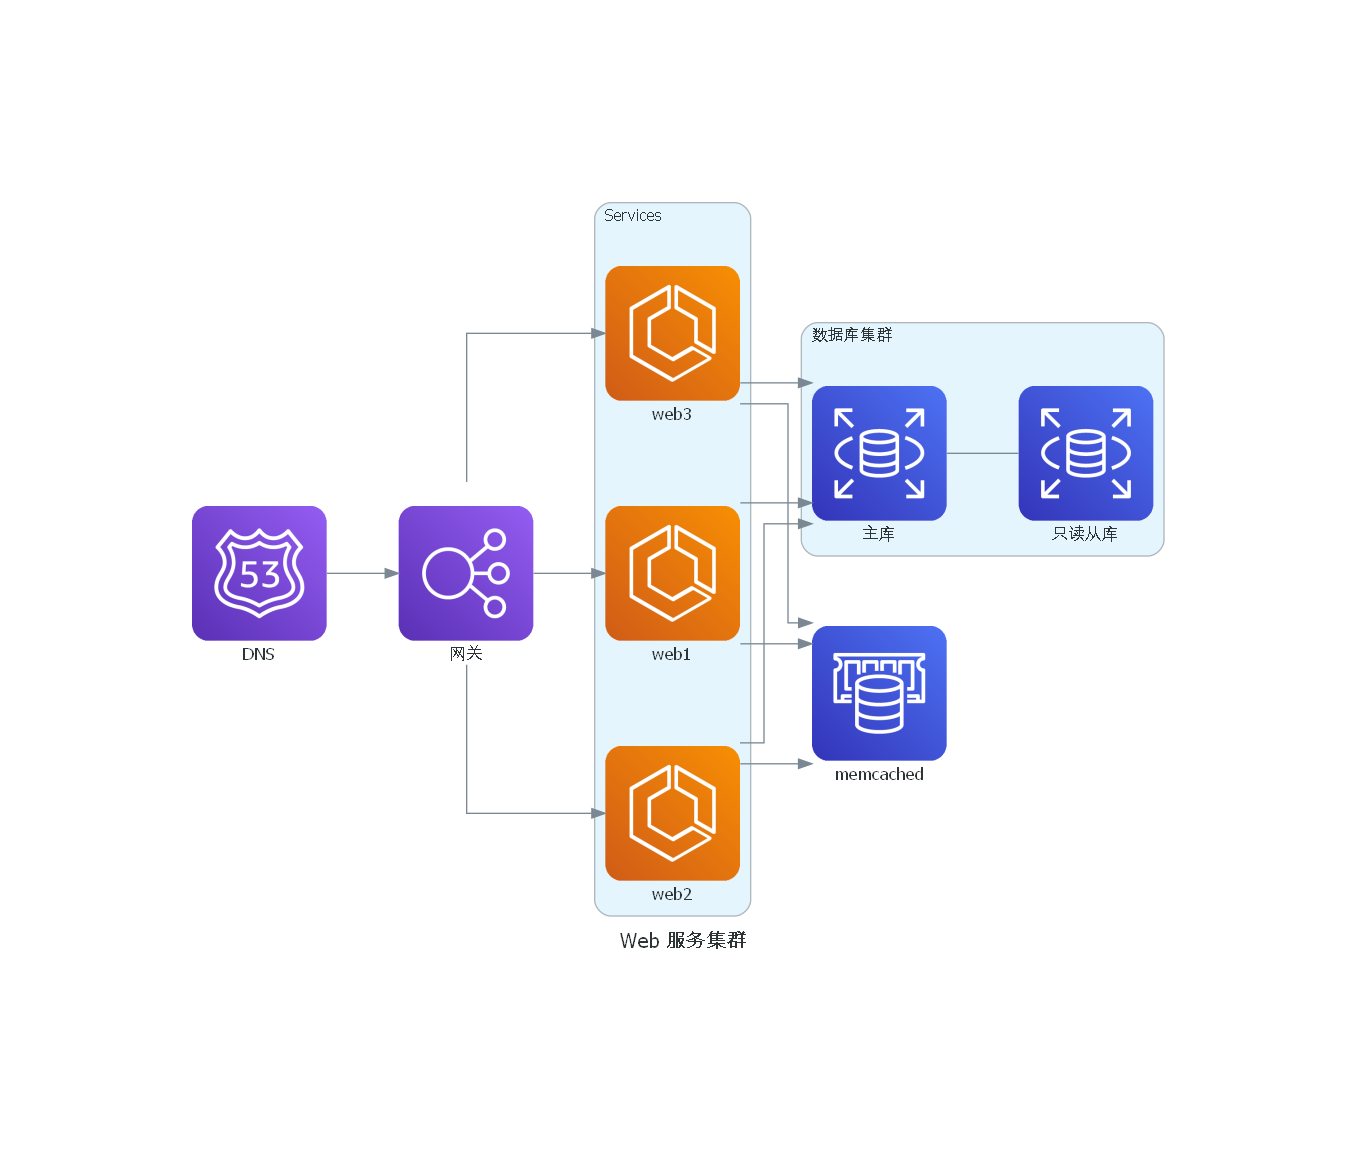
with Diagram("Web 服务集群", show=False, filename="3", graph_attr=graph_attr):
dns = Route53("DNS")
lb = ELB("网关")
with Cluster("Services"):
svc_group = [ECS("web1"),
ECS("web2"),
ECS("web3")]
with Cluster("数据库集群"):
db_primary = RDS("主库")
db_primary - [RDS("只读从库")]
memcached = ElastiCache("memcached")
dns >> lb >> svc_group
svc_group >> db_primary
svc_group >> memcached
事件处理队列
from diagrams import Cluster, Diagram
from diagrams.aws.compute import ECS, EKS, Lambda
from diagrams.aws.database import Redshift
from diagrams.aws.integration import SQS
from diagrams.aws.storage import S3

with Diagram("事件处理", show=False, filename="4"):
    source = EKS("k8s source")

    with Cluster("事件流"):
        with Cluster("Event Workers"):
            workers = [ECS("worker1"),
                       ECS("worker2"),
                       ECS("worker3")]

        queue = SQS("event 队列")

        with Cluster("处理器"):
            handlers = [Lambda("proc1"),
                        Lambda("proc2"),
                        Lambda("proc3")]

    store = S3("事件存储")
    dw = Redshift("analytics")

    source >> workers >> queue >> handlers
    handlers >> store
    handlers >> dw

消息收集系统
from diagrams import Cluster, Diagram
from diagrams.gcp.analytics import BigQuery, Dataflow, PubSub
from diagrams.gcp.compute import AppEngine, Functions
from diagrams.gcp.database import BigTable
from diagrams.gcp.iot import IotCore
from diagrams.gcp.storage import GCS
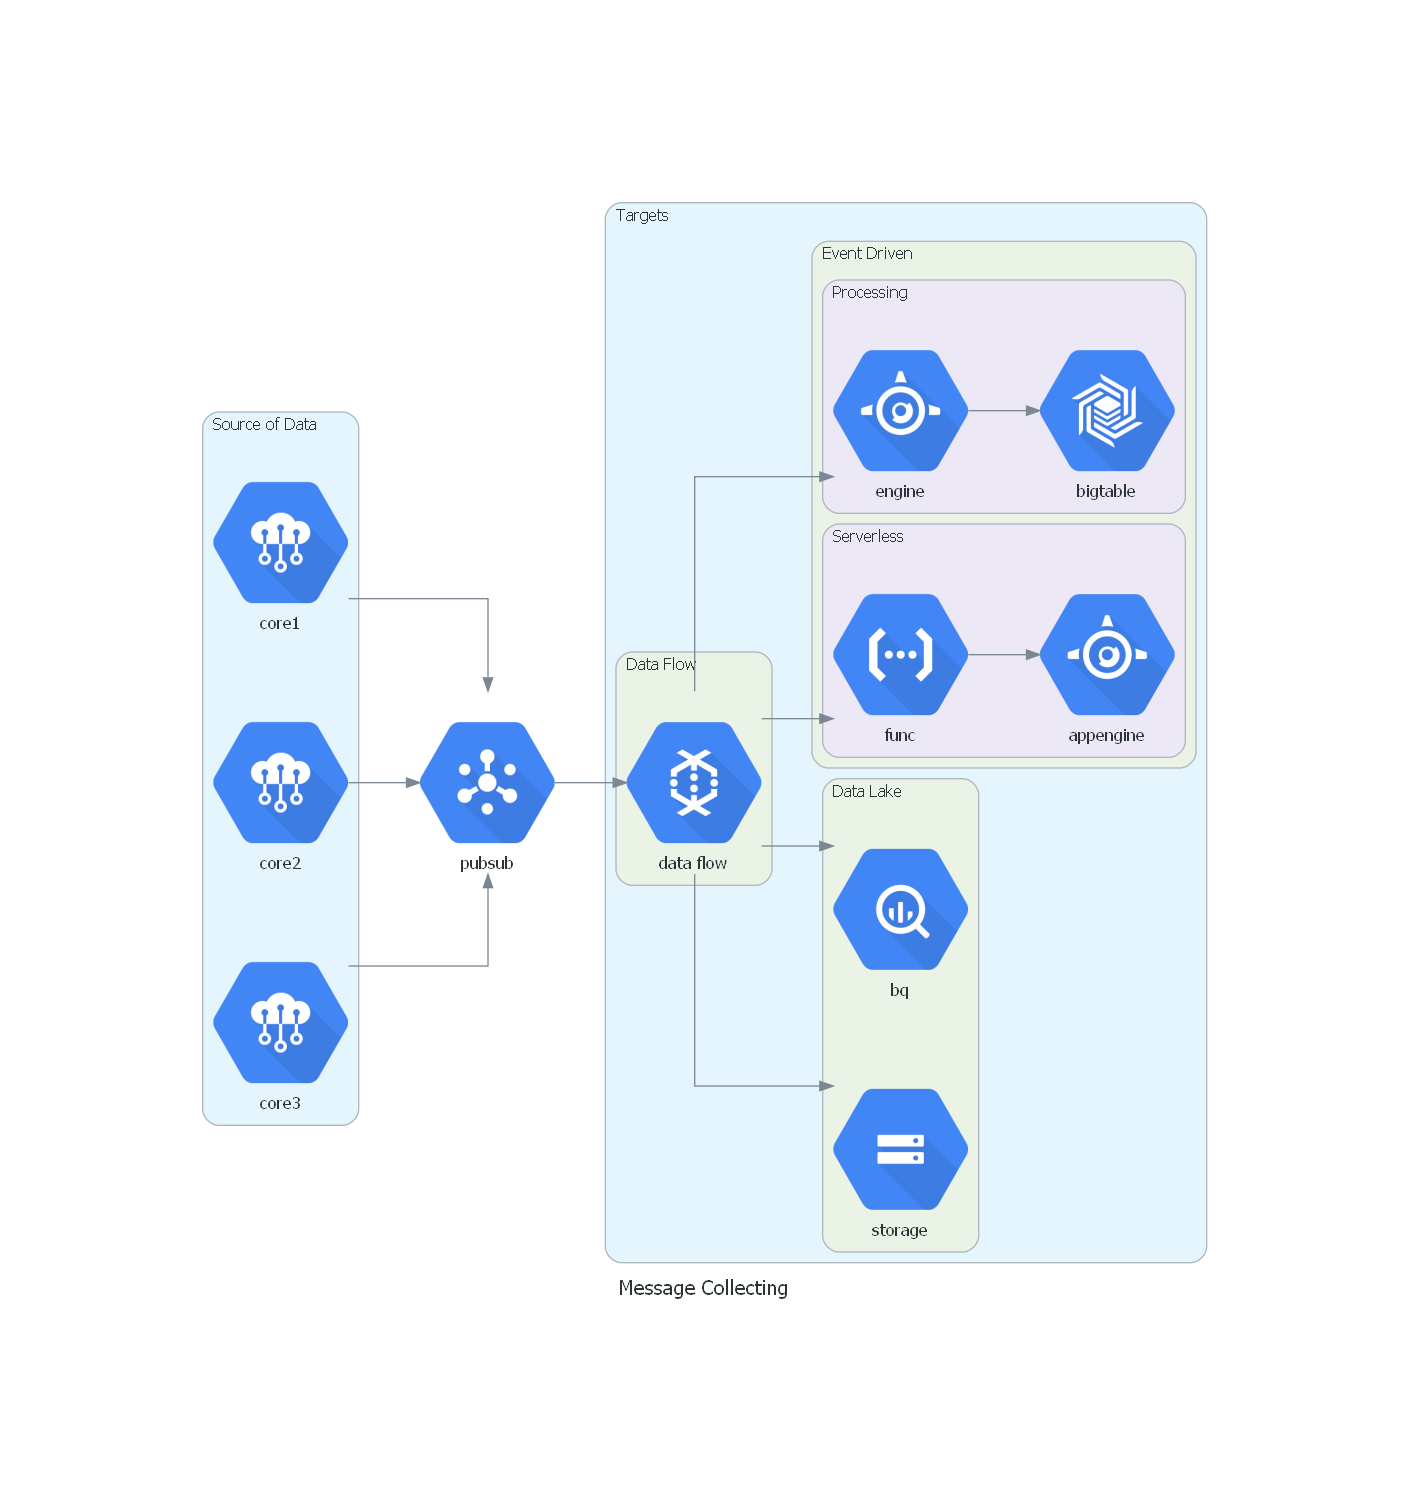
with Diagram("Message Collecting", show=False, filename="5"):
pubsub = PubSub("pubsub")
with Cluster("Source of Data"):
[IotCore("core1"),
IotCore("core2"),
IotCore("core3")] >> pubsub
with Cluster("Targets"):
with Cluster("Data Flow"):
flow = Dataflow("data flow")
with Cluster("Data Lake"):
flow >> [BigQuery("bq"),
GCS("storage")]
with Cluster("Event Driven"):
with Cluster("Processing"):
flow >> AppEngine("engine") >> BigTable("bigtable")
with Cluster("Serverless"):
flow >> Functions("func") >> AppEngine("appengine")
pubsub >> flow
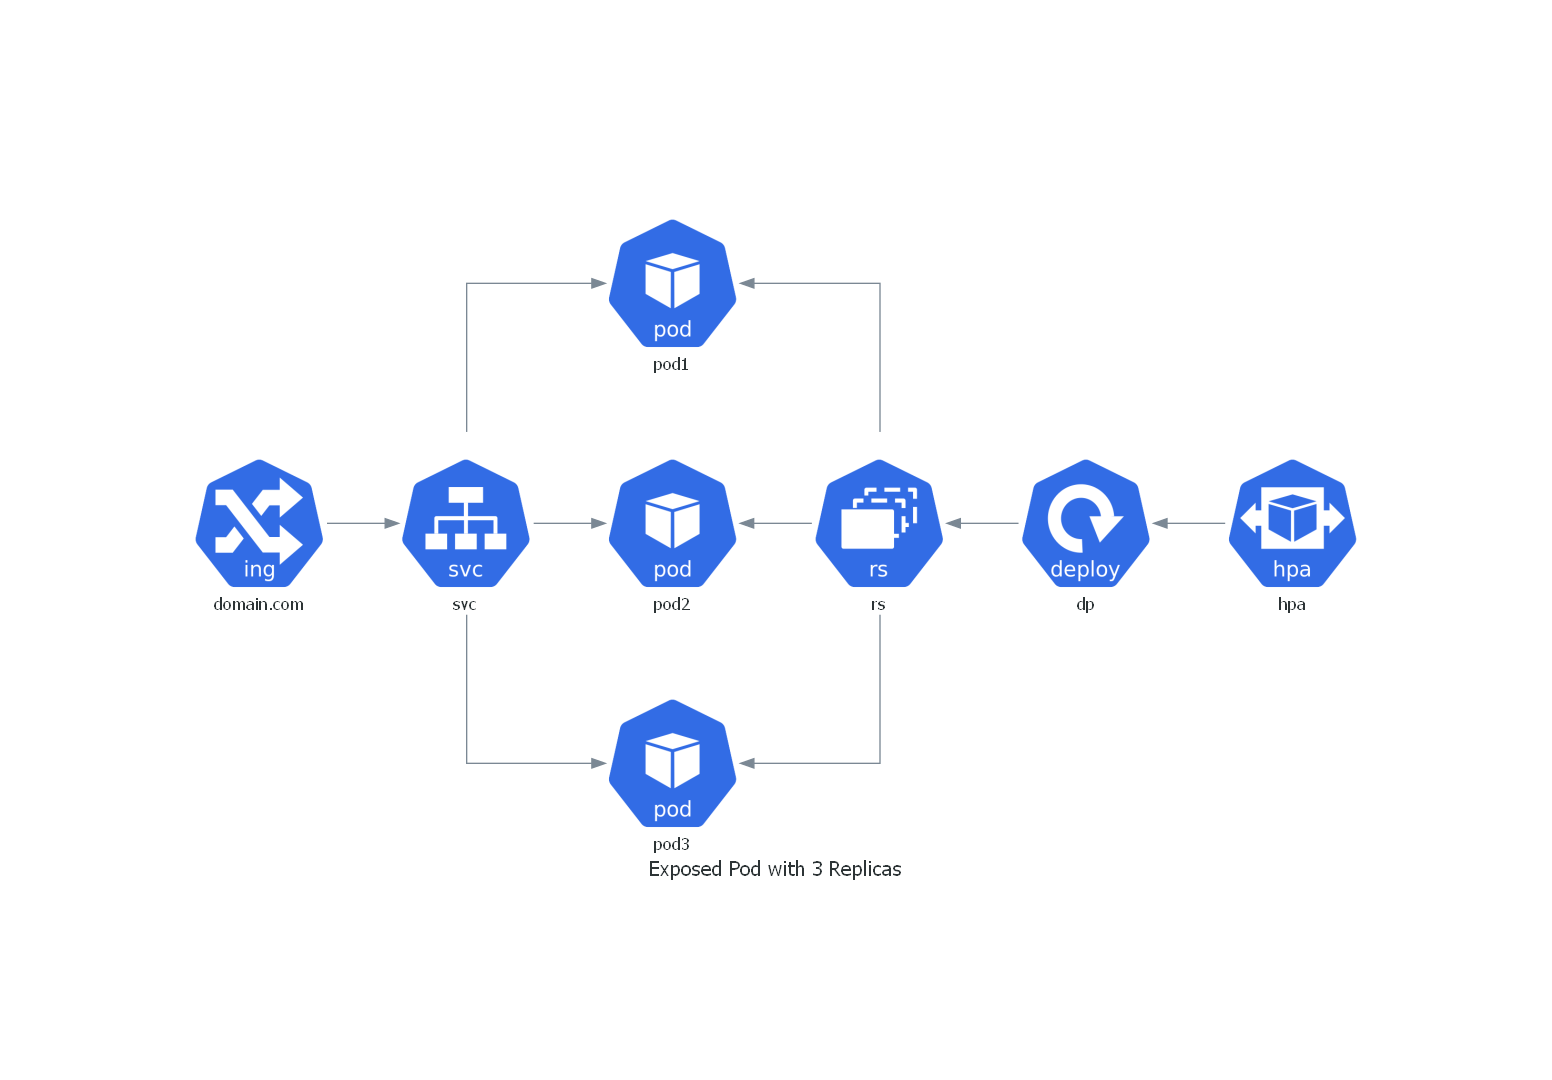
k8s中3副本pod
from diagrams import Diagram
from diagrams.k8s.clusterconfig import HPA
from diagrams.k8s.compute import Deployment, Pod, ReplicaSet
from diagrams.k8s.network import Ingress, Service

with Diagram("Exposed Pod with 3 Replicas", show=False, filename="6"):
    net = Ingress("domain.com") >> Service("svc")
    net >> [Pod("pod1"),
            Pod("pod2"),
            Pod("pod3")] << ReplicaSet("rs") << Deployment("dp") << HPA("hpa")
k8s有状态架构
from diagrams import Cluster, Diagram
from diagrams.k8s.compute import Pod, StatefulSet
from diagrams.k8s.network import Service
from diagrams.k8s.storage import PV, PVC, StorageClass

with Diagram("Stateful Architecture", show=False, filename="7"):
    with Cluster("Apps"):
        svc = Service("svc")
        sts = StatefulSet("sts")

        apps = []
        for _ in range(3):
            pod = Pod("pod")
            pvc = PVC("pvc")
            pod - sts - pvc
            apps.append(svc >> pod >> pvc)

    apps << PV("pv") << StorageClass("sc")

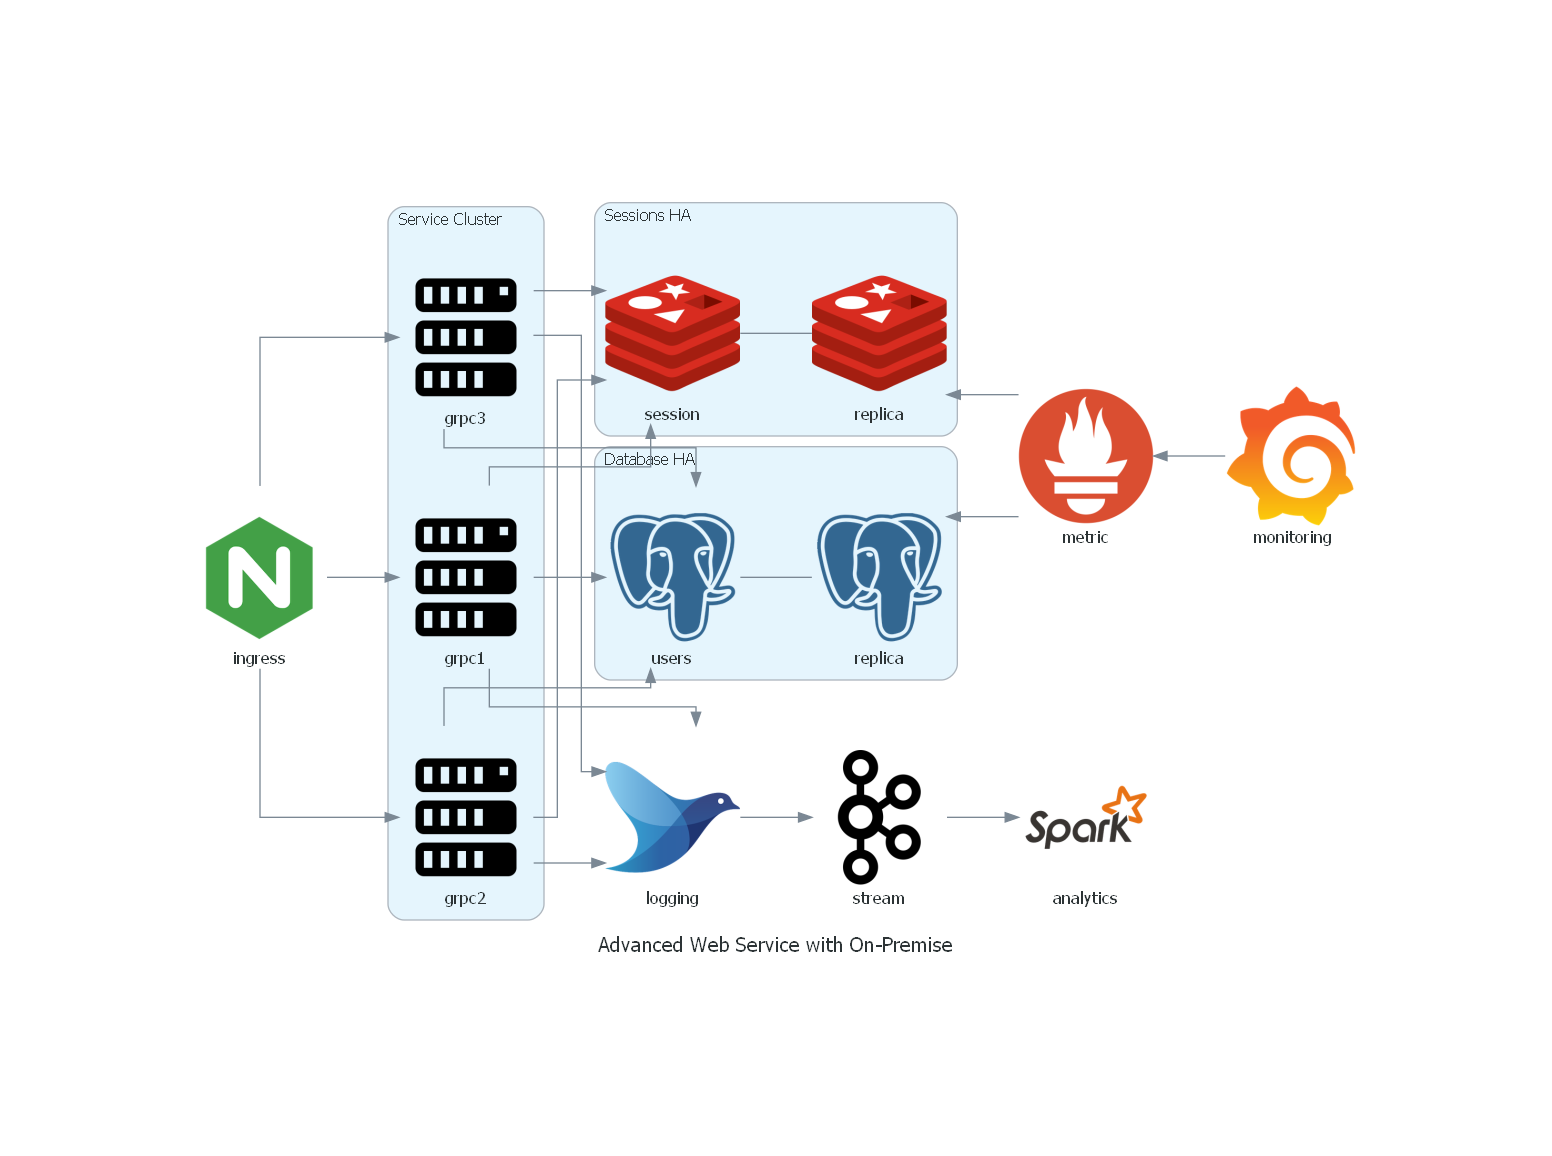
高级web服务架构
from diagrams import Cluster, Diagram
from diagrams.onprem.analytics import Spark
from diagrams.onprem.compute import Server
from diagrams.onprem.database import PostgreSQL
from diagrams.onprem.inmemory import Redis
from diagrams.onprem.aggregator import Fluentd
from diagrams.onprem.monitoring import Grafana, Prometheus
from diagrams.onprem.network import Nginx
from diagrams.onprem.queue import Kafka

with Diagram("Advanced Web Service with On-Premise", show=False, filename="8"):
    ingress = Nginx("ingress")

    metrics = Prometheus("metric")
    metrics << Grafana("monitoring")

    with Cluster("Service Cluster"):
        grpcsvc = [
            Server("grpc1"),
            Server("grpc2"),
            Server("grpc3")]

    with Cluster("Sessions HA"):
        primary = Redis("session")
        primary - Redis("replica") << metrics
        grpcsvc >> primary

    with Cluster("Database HA"):
        primary = PostgreSQL("users")
        primary - PostgreSQL("replica") << metrics
        grpcsvc >> primary

    aggregator = Fluentd("logging")
    aggregator >> Kafka("stream") >> Spark("analytics")

    ingress >> grpcsvc >> aggregator
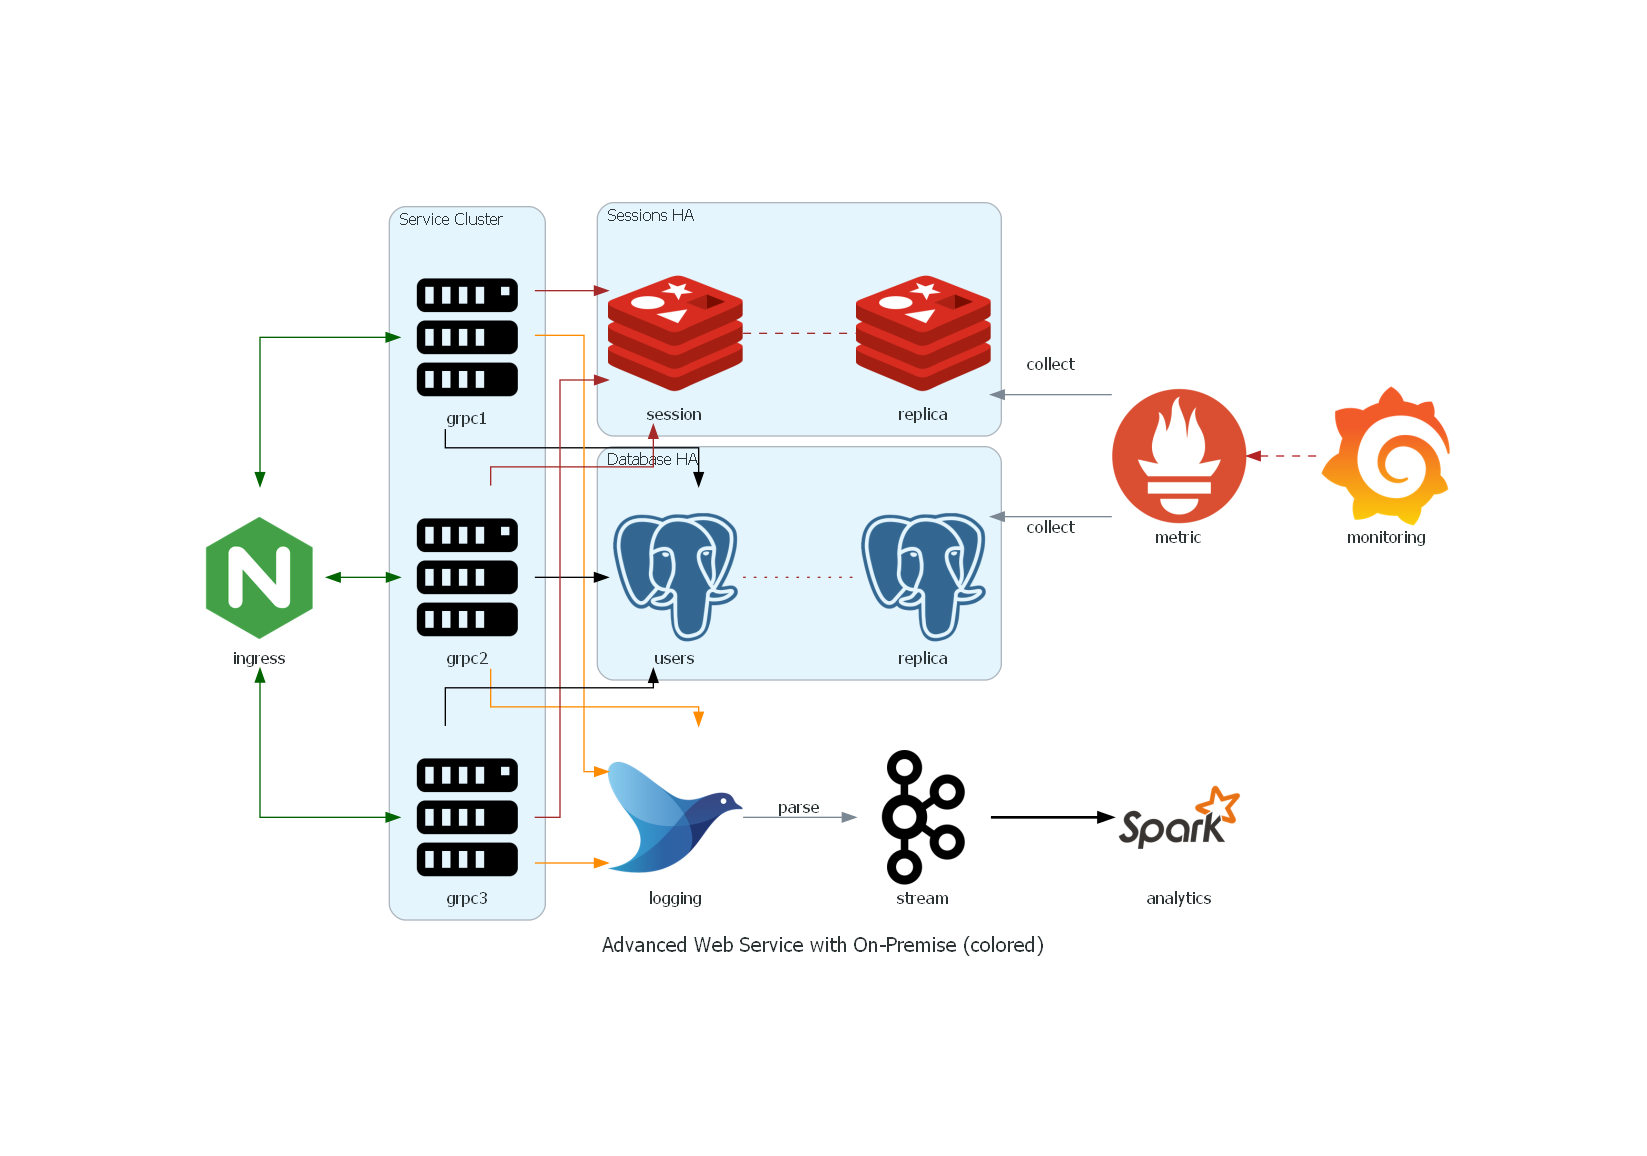
高级web服务架构2
from diagrams import Cluster, Diagram, Edge
from diagrams.onprem.analytics import Spark
from diagrams.onprem.compute import Server
from diagrams.onprem.database import PostgreSQL
from diagrams.onprem.inmemory import Redis
from diagrams.onprem.aggregator import Fluentd
from diagrams.onprem.monitoring import Grafana, Prometheus
from diagrams.onprem.network import Nginx
from diagrams.onprem.queue import Kafka

with Diagram(name="Advanced Web Service with On-Premise (colored)", show=False, filename="9"):
    ingress = Nginx("ingress")

    metrics = Prometheus("metric")
    metrics << Edge(color="firebrick", style="dashed") << Grafana("monitoring")

    with Cluster("Service Cluster"):
        grpcsvc = [
            Server("grpc1"),
            Server("grpc2"),
            Server("grpc3")]

    with Cluster("Sessions HA"):
        primary = Redis("session")
        primary - Edge(color="brown", style="dashed") - Redis("replica") << Edge(label="collect") << metrics
        grpcsvc >> Edge(color="brown") >> primary

    with Cluster("Database HA"):
        primary = PostgreSQL("users")
        primary - Edge(color="brown", style="dotted") - PostgreSQL("replica") << Edge(label="collect") << metrics
        grpcsvc >> Edge(color="black") >> primary

    aggregator = Fluentd("logging")
    aggregator >> Edge(label="parse") >> Kafka("stream") >> Edge(color="black", style="bold") >> Spark("analytics")

    ingress >> Edge(color="darkgreen") << grpcsvc >> Edge(color="darkorange") >> aggregator
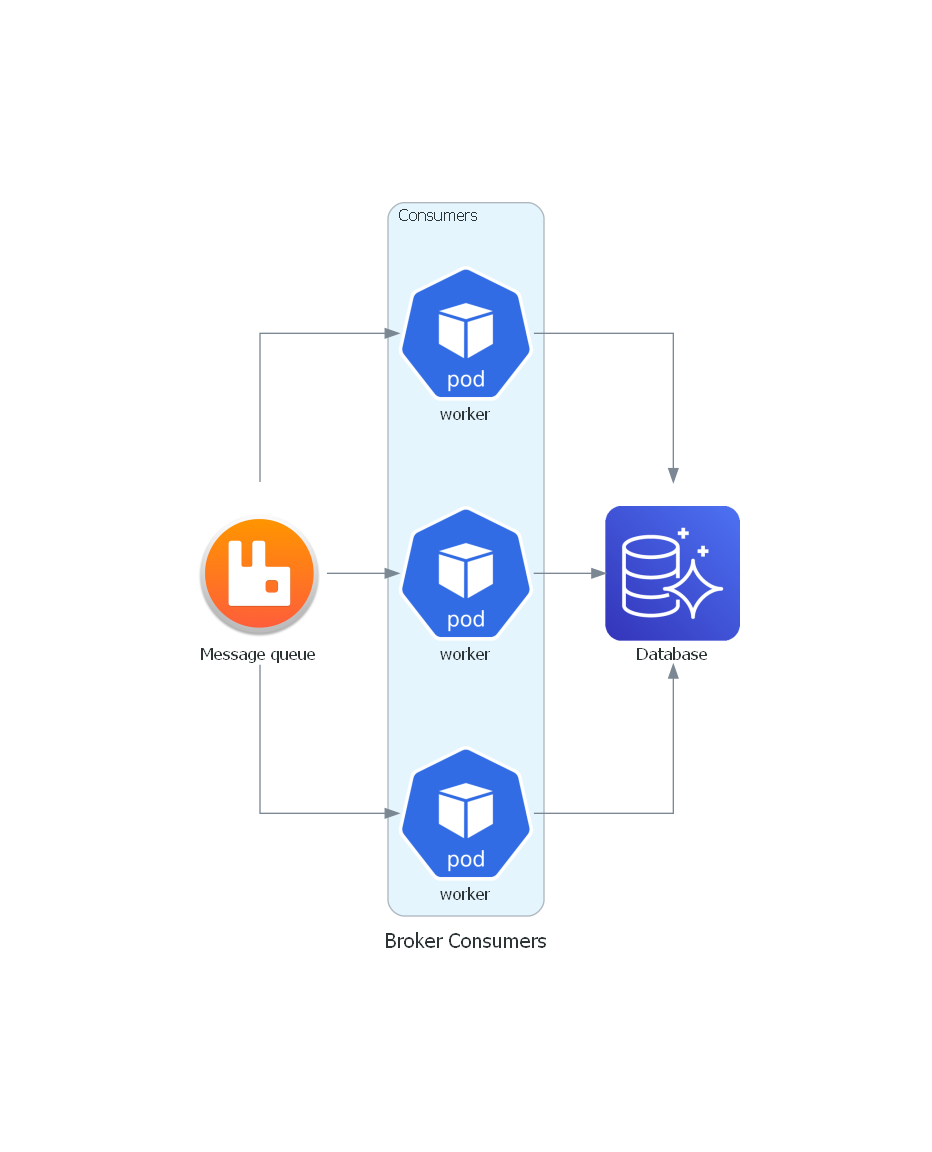
使用自定义的图标
from urllib.request import urlretrieve

from diagrams import Cluster, Diagram
from diagrams.aws.database import Aurora
from diagrams.custom import Custom
from diagrams.k8s.compute import Pod

# Download an image to be used into a Custom Node class
rabbitmq_url = "https://jpadilla.github.io/rabbitmqapp/assets/img/icon.png"
rabbitmq_icon = "rabbitmq.png"
urlretrieve(rabbitmq_url, rabbitmq_icon)

with Diagram("Broker Consumers", show=False, filename="10"):
    with Cluster("Consumers"):
        consumers = [
            Pod("worker"),
            Pod("worker"),
            Pod("worker")]

    queue = Custom("Message queue", rabbitmq_icon)

    queue >> consumers >> Aurora("Database")
参考
本文来自博客园,作者:花酒锄作田,转载请注明原文链接:https://www.cnblogs.com/XY-Heruo/p/python-diagrams.html

 浙公网安备 33010602011771号