
简单搭建基本Prometheus监控系统
前言
- 适用场景:新手入门;内网离线部署,只是需要了解服务器基本情况,不需要告警系统。
- 需要准备的安装包:
- grafana的docker包(先在线下载,然后
docker save保存镜像。如果没有docker,还需要准备docker的离线安装包) - prometheus和node_exporter官方下载地址
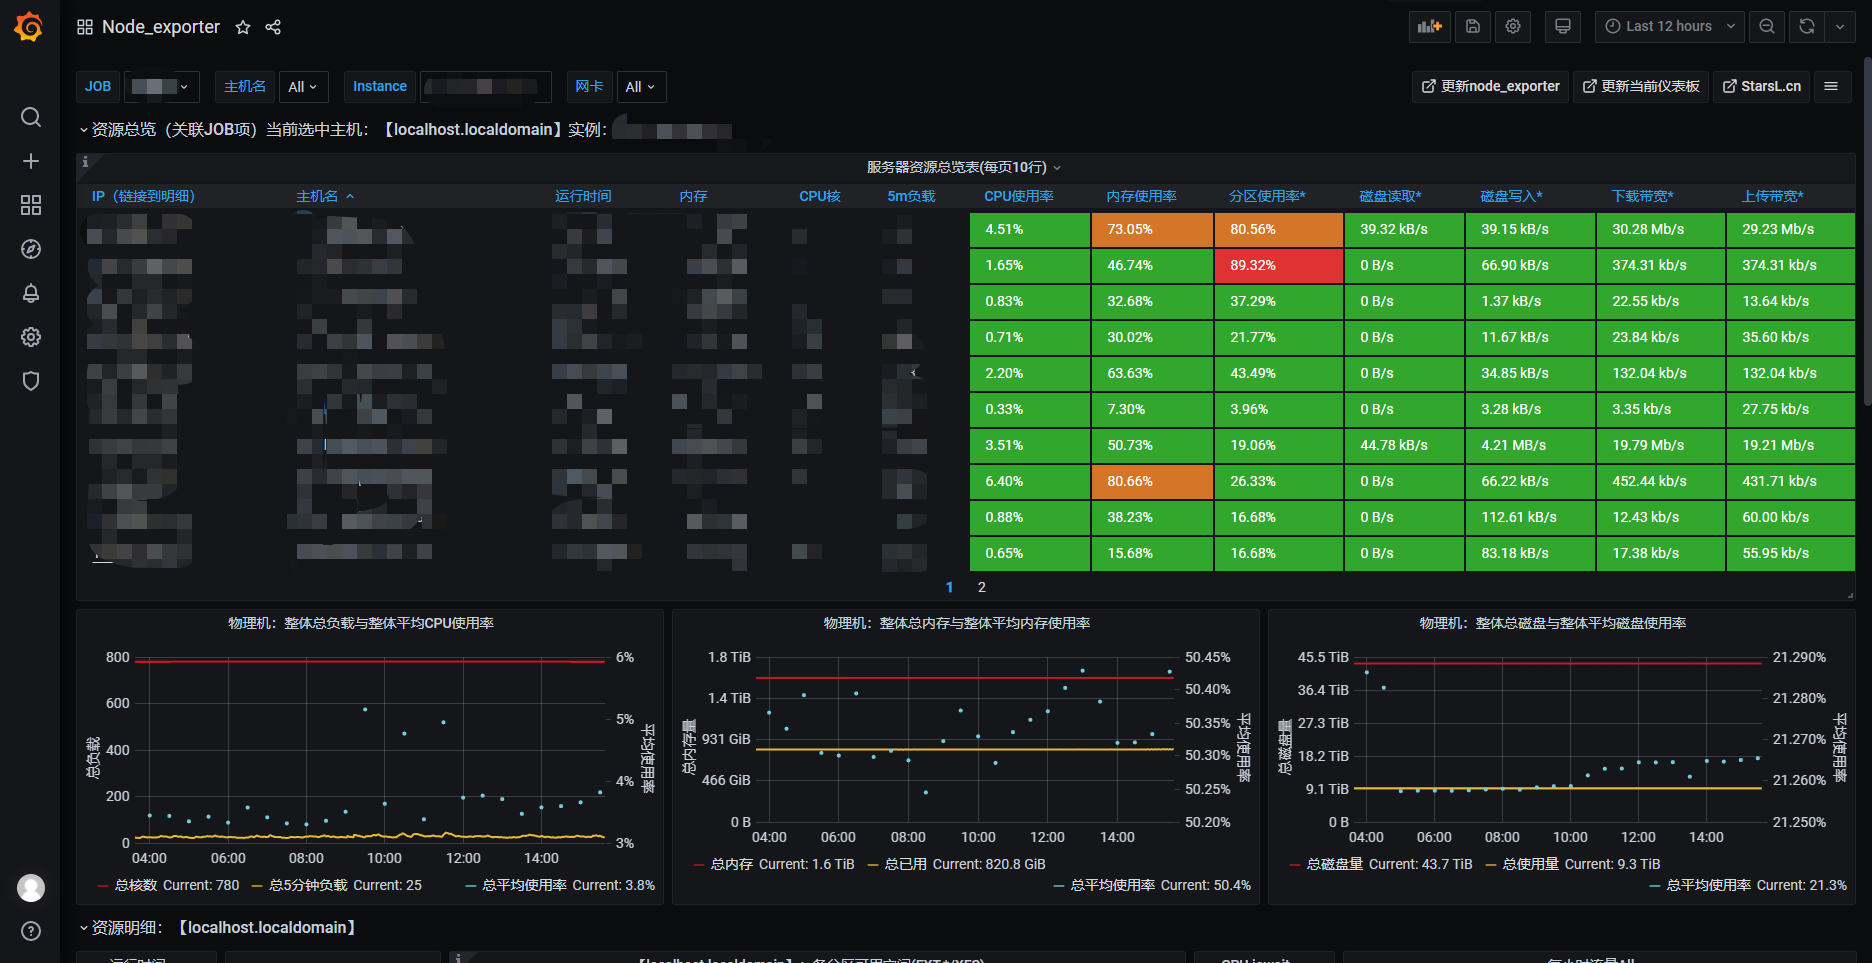
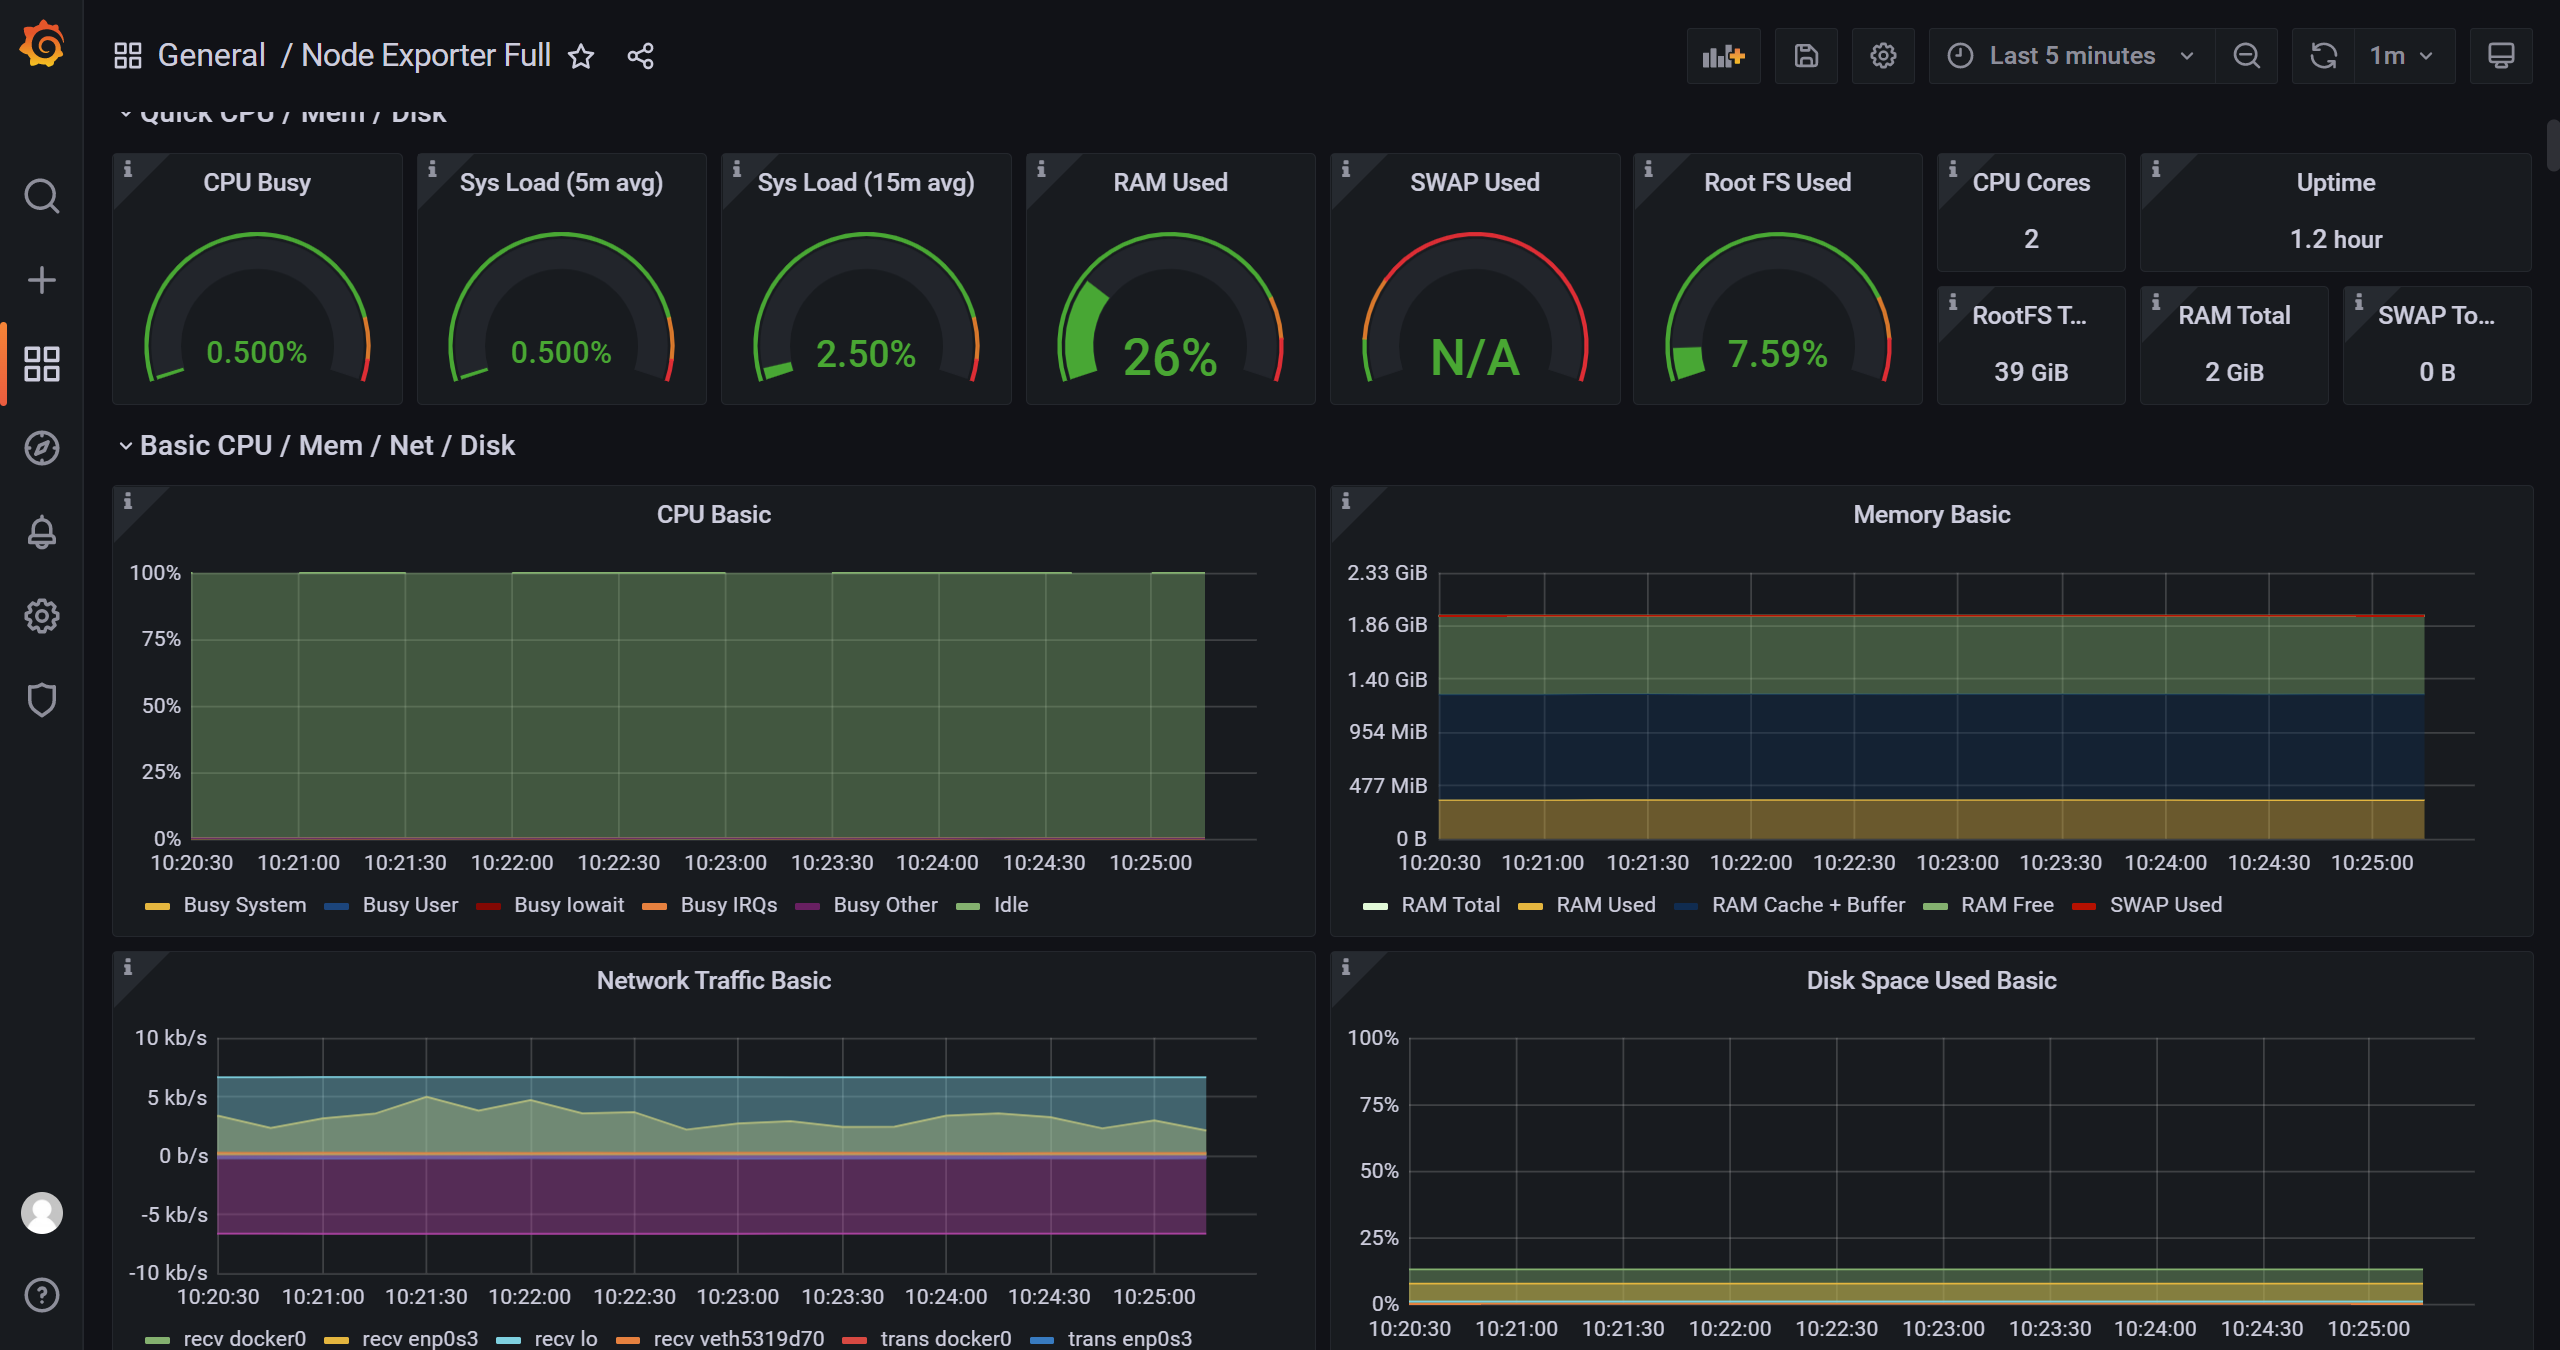
- 从grafana官方下载dashboard的json文件,ID为8919或1860
- grafana的docker包(先在线下载,然后
| 系统版本 | IP | 应用 | 应用版本 | 说明 |
|---|---|---|---|---|
| centos 7 x86-64 | 192.168.0.11 | prometheus | 2.37.1 | 服务端 |
| centos 7 x86-64 | 192.168.0.11 | node_exporter | 1.3.1 | 客户端 |
| centos 7 x86-64 | 192.168.0.11 | grafana | 8.3.3 | 可视化 |
安装prometheus
- 解压和创建目录
mkdir -p /home/apps
tar xf prometheus-2.37.1.linux-amd64.tar.gz -C /home/apps
cd /home/apps
mv prometheus-2.37.1.linux-amd64 prometheus
rm -f prometheus-2.37.1.linux-amd64.tar.gz
cd prometheus
mkdir sd_configs data
- 编辑服务配置文件:
vim /home/apps/prometheus/prometheus.yml
# my global config
global:
  scrape_interval:     15s # Set the scrape interval to every 15 seconds. Default is every 1 minute.
  evaluation_interval: 15s # Evaluate rules every 15 seconds. The default is every 1 minute.
  # scrape_timeout is set to the global default (10s).

# Alertmanager configuration
alerting:
  alertmanagers:
  - static_configs:
    - targets:
      # - alertmanager:9093

# Load rules once and periodically evaluate them according to the global 'evaluation_interval'.
rule_files:
  # - "first_rules.yml"
  # - "second_rules.yml"

# 修改以下内容
scrape_configs:
  # The job name is added as a label `job=<job_name>` to any timeseries scraped from this config.
  - job_name: 'prometheus'
    file_sd_configs:
    - files: ['/home/apps/prometheus/sd_configs/*.yml']
      refresh_interval:  10s
- 启动。(启动脚本可参考"附录 - prometheus启动脚本")
nohup /home/apps/prometheus/prometheus \
	--storage.tsdb.path=/home/apps/prometheus/data \
	--config.file=/home/apps/prometheus/prometheus.yml \
	--web.listen-address=:19090 \
	--storage.tsdb.retention=15d > /dev/null 2>&1 &
参数说明:
-storage.tsdb.path:数据存储路径-config.file:配置文件路径-web.listen-address:服务监听端口-storage.tsdb.retention:数据存储期限。这里设置为15天
- 编辑文件服务发现的配置文件:
vim /home/web/prometheus/prometheus/sd_configs/nodes.yml
- targets: ['192.168.0.11:19091']
  labels:
    instance: 192.168.0.11
- Prometheus服务端配置完成
安装node_exporter
- 解压和修改目录名
tar xf node_exporter-1.3.1.linux-amd64.tar.gz -C /home/apps
cd /home/apps
mv node_exporter-1.3.1.linux-amd64 node_exporter
- 启动。(启动脚本可参考“附录 - node_exporter启动脚本”)
nohup /home/apps/node_exporter/node_exporter \
	--collector.processes \
	--web.listen-address 0.0.0.0:19091 > /dev/null 2>&1 &
参数说明:
-web.listen-address:监听19091端口--collector.processes:收集进程相关指标
- 客户端配置完成
配置grafana
- 使用
docker load -i指令加载事先准备好的docker镜像 - 创建容器并运行:
docker run -d --name=grafa -p 3000:3000 grafana/grafana:latest
- 浏览器打开
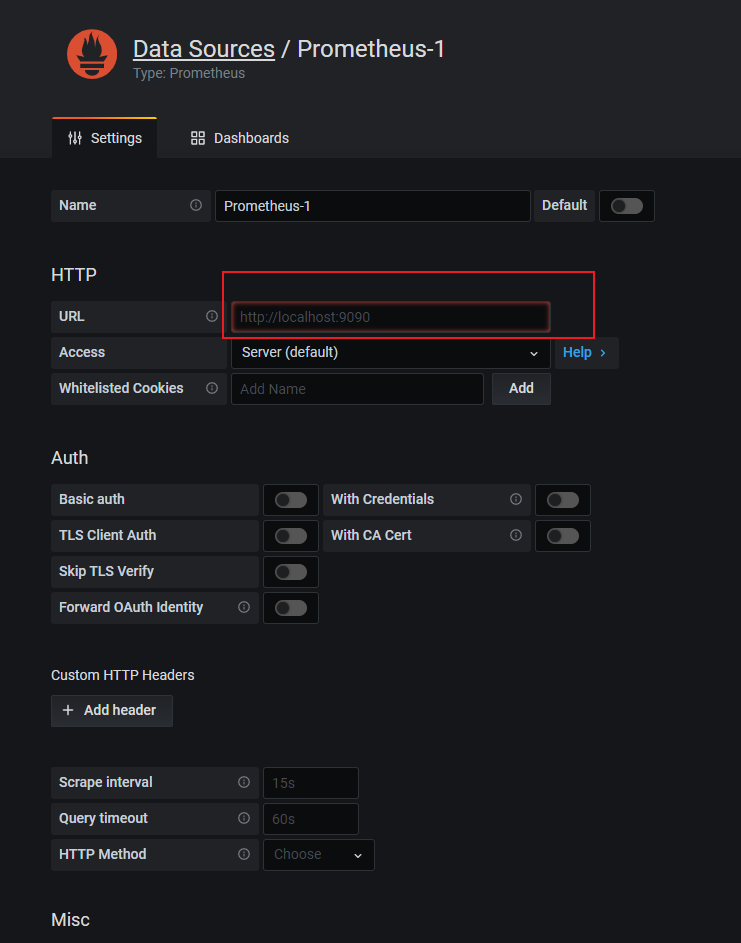
192.168.0.10:3000,默认账户名为admin,默认密码为admin - 添加Prometheus数据源,地址为:192.168.0.10:19090
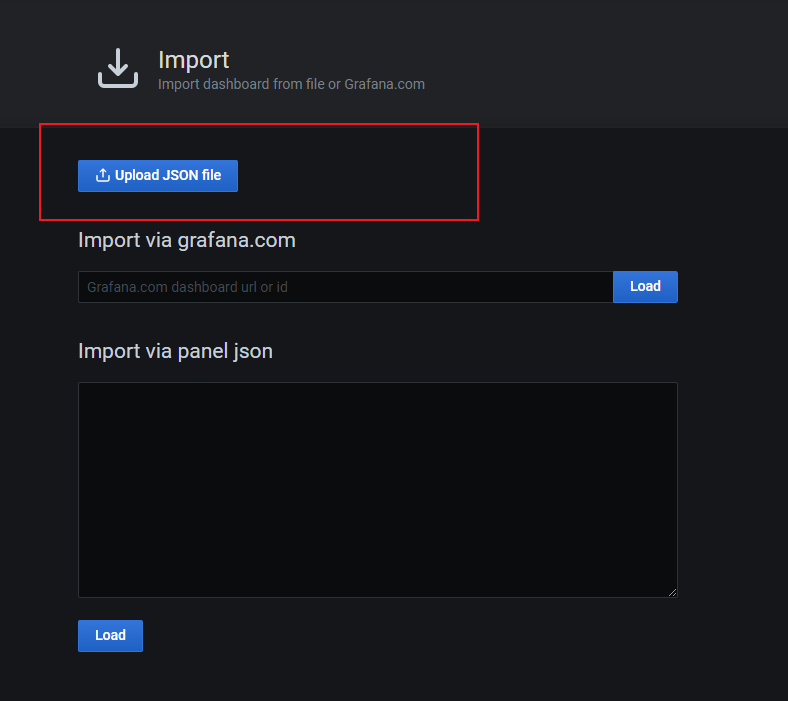
- 导入事先准备好的json
- grafana配置完成
附录
prometheus启动脚本
#!/bin/bash
# description: prometheus的启动脚本

set -u

script_dir=$(cd $(dirname $0) && pwd)

function checkEnv() {
    # 检查环境
    [ -d ${script_dir}/data ] || mkdir -p ${script_dir}/data
    [ -d ${script_dir}/sd_configs ] || mkdir -p ${script_dir}/sd_configs

    timeout 1 bash -c "cat < /dev/null > /dev/tcp/127.0.0.1/19090"
    if [[ $? -ne 0 ]]; then
        echo "19090端口已被占用, 请修改启动脚本中的端口号"
        exit 1
    fi
}

function startApp() {
    # 启动
    nohup ${script_dir}/prometheus \
        --storage.tsdb.path=${script_dir}/data \
        --config.file=${script_dir}/prometheus.yml \
        --web.listen-address=:19090 \
        --storage.tsdb.retention=15d > /dev/null 2>&1 &
}

function main() {
    checkEnv
    startApp
}

main
node_exporter启动脚本
#!/bin/bash
# description: node_exporter启动脚本

set -u

script_dir=$(cd $(dirname $0) && pwd)

function checkEnv() {
	# 检查环境
    timeout 1 bash -c "cat < /dev/null > /dev/tcp/127.0.0.1/19091"
    if [[ $? -ne 0 ]]; then
        echo "19091端口已被占用, 请修改启动脚本中的端口号"
        exit 1
    fi
}

function startApp() {
	# 启动
    nohup ${script_dir}/node_exporter \
        --collector.systemd \
        --collector.processes \
        --web.listen-address 0.0.0.0:19091 > /dev/null 2>&1 &
}

function main() {
    # 入口主函数
    startapp
}

main
本文来自博客园,作者:花酒锄作田,转载请注明原文链接:https://www.cnblogs.com/XY-Heruo/p/15002337.html
