入门基础操作
一、命令窗基本操作
1、format loose:稀疏显示
2、format compact:紧凑显示
3、format rat:分数显示
4、clear:清除工作空间
5、quit、exit:退出软件
6、help:显示已有的函数和对应的目录
二、让你的代码更具有可读性
M文件
运用cell module
举例:代码如下
%% Program Start
%lms算法源程序
clear all
close all
%channel system order
sysorder = 5 ;
% Number of system points
N=2000;
inp = randn(N,1);
n = randn(N,1);
[b,a] = butter(2,0.25);
Gz = tf(b,a,-1);%传递函数
%This function is submitted to make inverse Z-transform (Matlab central file exchange)
%The first sysorder weight value
%h=ldiv(b,a,sysorder)';
% if you use ldiv this will give h :filter weights to be
h= [0.0976;
0.2873;
0.3360;
0.2210;
0.0964;];
y = lsim(Gz,inp);
%% add some noise
n = n * std(y)/(10*std(n));
d = y + n;
totallength=size(d,1);
%Take 60 points for training
N=60 ;
%%
% <http://www.mathworks.com MathWorks>
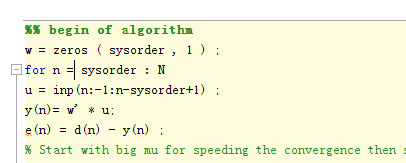
%% begin of algorithm
w = zeros ( sysorder , 1 ) ;
for n = sysorder : N
u = inp(n:-1:n-sysorder+1) ;
y(n)= w' * u;
e(n) = d(n) - y(n) ;
% Start with big mu for speeding the convergence then slow down to reach the correct weights
if n < 20
mu=0.32;
else
mu=0.15;
end
w = w + mu * u * e(n) ;
end
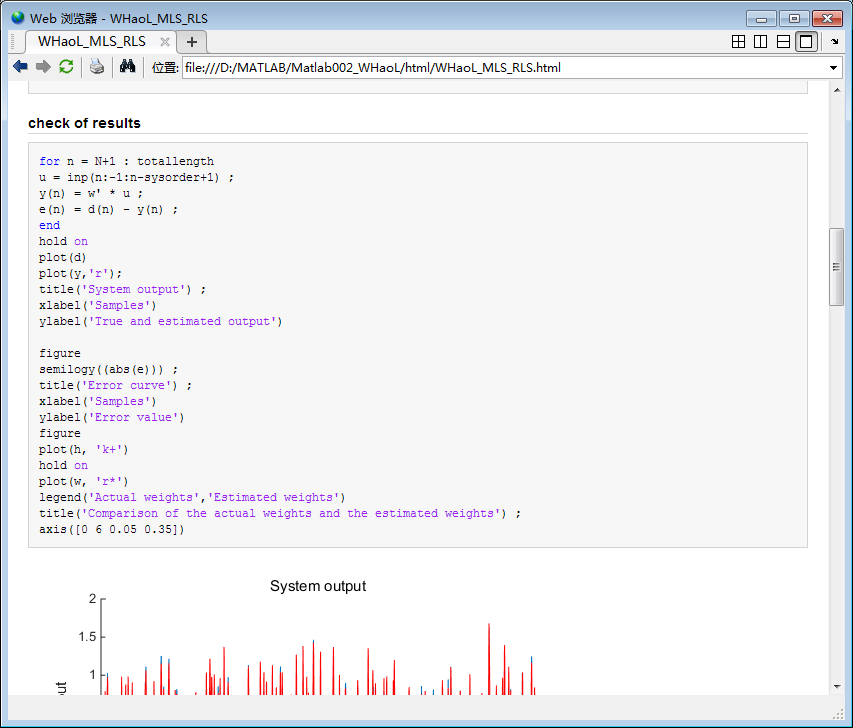
%% check of results
for n = N+1 : totallength
u = inp(n:-1:n-sysorder+1) ;
y(n) = w' * u ;
e(n) = d(n) - y(n) ;
end
hold on
plot(d)
plot(y,'r');
title('System output') ;
xlabel('Samples')
ylabel('True and estimated output')
figure
semilogy((abs(e))) ;
title('Error curve') ;
xlabel('Samples')
ylabel('Error value')
figure
plot(h, 'k+')
hold on
plot(w, 'r*')
legend('Actual weights','Estimated weights')
title('Comparison of the actual weights and the estimated weights') ;
axis([0 6 0.05 0.35])
%% RLS Algorithm 算法
randn('seed', 0) ;
rand('seed', 0) ;
NoOfData = 8000 ; % Set no of data points used for training
Order = 32 ; % Set the adaptive filter order
Lambda = 0.98 ; % Set the forgetting factor
Delta = 0.001 ; % R initialized to Delta*I
x = randn(NoOfData, 1) ;% Input assumed to be white
h = rand(Order, 1) ; % System picked randomly
d = filter(h, 1, x) ; % Generate output (desired signal)
% Initialize RLS
P = Delta * eye ( Order, Order ) ;
w = zeros ( Order, 1 ) ;
% RLS Adaptation
for n = Order : NoOfData ;
u = x(n:-1:n-Order+1) ;
pi_ = u' * P ;
k = Lambda + pi_ * u ;
K = pi_'/k;
e(n) = d(n) - w' * u ;
w = w + K * e(n) ;
PPrime = K * pi_ ;
P = ( P - PPrime ) / Lambda ;
w_err(n) = norm(h - w) ;
end ;
%% Plot results
figure ;
plot(20*log10(abs(e))) ;
title('Learning Curve') ;
xlabel('Iteration Number') ;
ylabel('Output Estimation Error in dB') ;
figure ;
semilogy(w_err) ;
title('Weight Estimation Error') ;
xlabel('Iteration Number') ;
ylabel('Weight Error in dB') ;
操作如下:
1、在每段开头使用 (%%+空格+每段代码的名字)
2、发布

让运行后的代码更具备可读性(会把运行结果加到相应的代码后面)
效果如下:file:///D:/MATLAB/Matlab002_WHaoL/html/WHaoL_MLS_RLS.html
:D:/MATLAB/Matlab002_WHaoL/html/WHaoL_MLS_RLS.html

 浙公网安备 33010602011771号