folium 使用总结以及问题记录
背景:工作需要使用地址范围文件中的经纬度连线在地图上描绘出该范围,并显示给定地点信息
模块选择:folium,底图丰富多样,使用简单易上手,创建交互式地图
模块使用
1. 初始化一个map对象
# location 选定map的中心点坐标  tiles 选择底图,不传会使用默认底图
"""
# 高德底图
tiles='http://wprd02.is.autonavi.com/appmaptile?x={x}&y={y}&z={z}&lang=zh_cn&size=1&scl=1&style=7',
# mapbox底图 access_token需要自己去mapbox网站注册获取
tiles = "https://{s}.tiles.mapbox.com/v4/mapbox.emerald/{z}/{x}/{y}.png?access_token=sk.eyJ1IjoiaHVhbjEwMjEiLCJhIjoiY2tjb2ppeXpwMGxwZDJwcGJqNTh1MnBtaSJ9.NIAiFTr9VLiHMBy52Z_F9A"
"""
# zoom_start:地图zoom的初始级别,默认为10。假设改成11的话,那么就相当于在默认创建的地图的级别上放大一级。
Map = folium.Map(location=map_settings.MID_LOCATION,
                 zoom_start=10,
                 tiles=map_settings.MAP_TILES,
                 tiles='http://wprd02.is.autonavi.com/appmaptile?x={x}&y={y}&z={z}&lang=zh_cn&size=1&scl=1&style=7',
                 attr='default'
                 )
2. 使用Marker描点添加到地图上,当点比较多时可以使用plugins.MarkerCluster()聚合,缩小后显示数量,点击放大
folium.Marker([31.3255631839587,121.128785471592],
              popup=folium.Popup("地点信息", max_width=1000)).add_to(Map)
"""
:param
location: 坐标
popup: 使用folium.Popup()渲染, Popup方法必传显示信息,支持html,加上parse_html=True便会把原始内容当成普通字符串来解析
icon: 可以使用folium.Icon() 渲染,更改显示的样式颜色,默认是水滴图标
"""
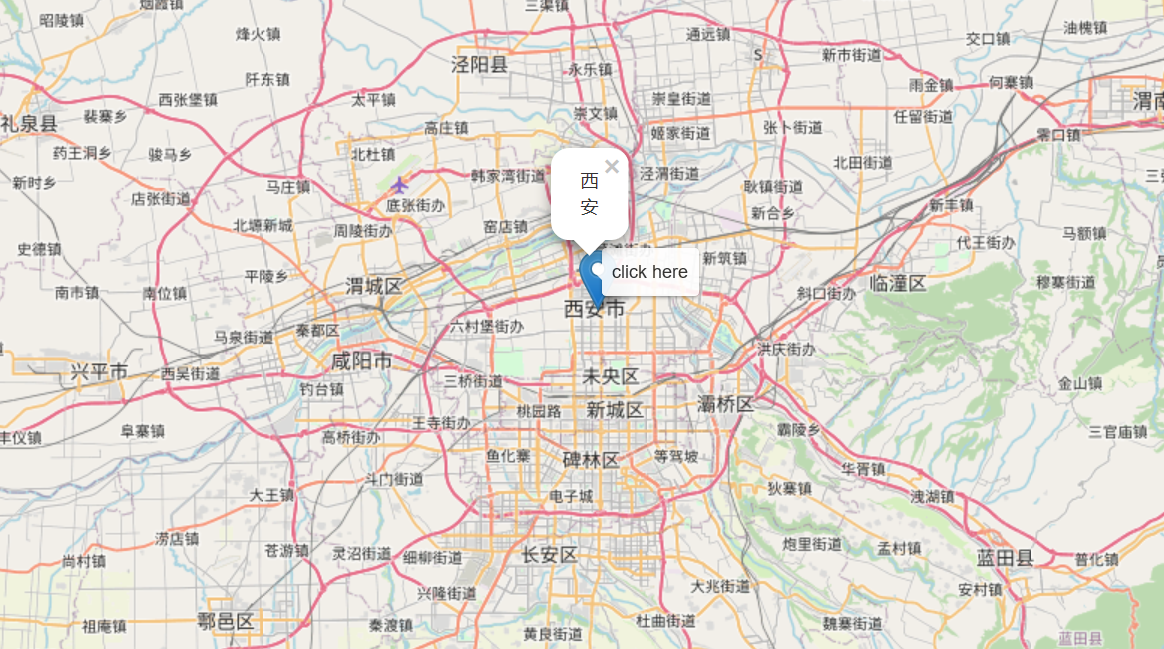
描点示例:
folium.Marker([34.343147, 108.939621], popup=folium.Popup("西安"), tooltip="click here").add_to(Map)
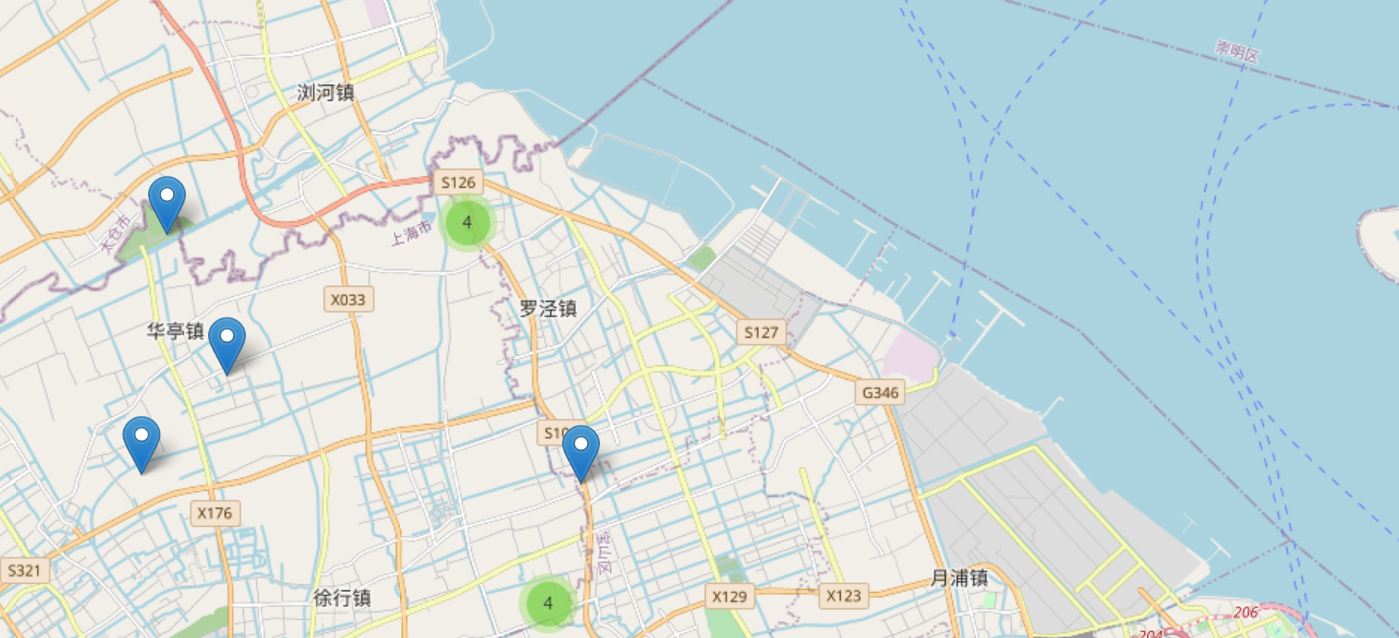
plugins.MarkerCluster()聚合示例:
3. Polygon 绘制多边形填充地图,也可以使用PolyLine 线段连接
- Polygon第一个参数为坐标列表,popup同上
- color为多边形边线的颜色,fill_color表示填充的颜色, fillOpacity代表透明度
folium.Polygon(location, popup=folium.Popup(police_station[j], max_width=1000), tooltip='click here'
               , color=map_settings.fill_color.get(police_station[j])
               , fill_color=map_settings.fill_color.get(police_station[j])
               , fillOpacity=0.6
               ).add_to(Map)
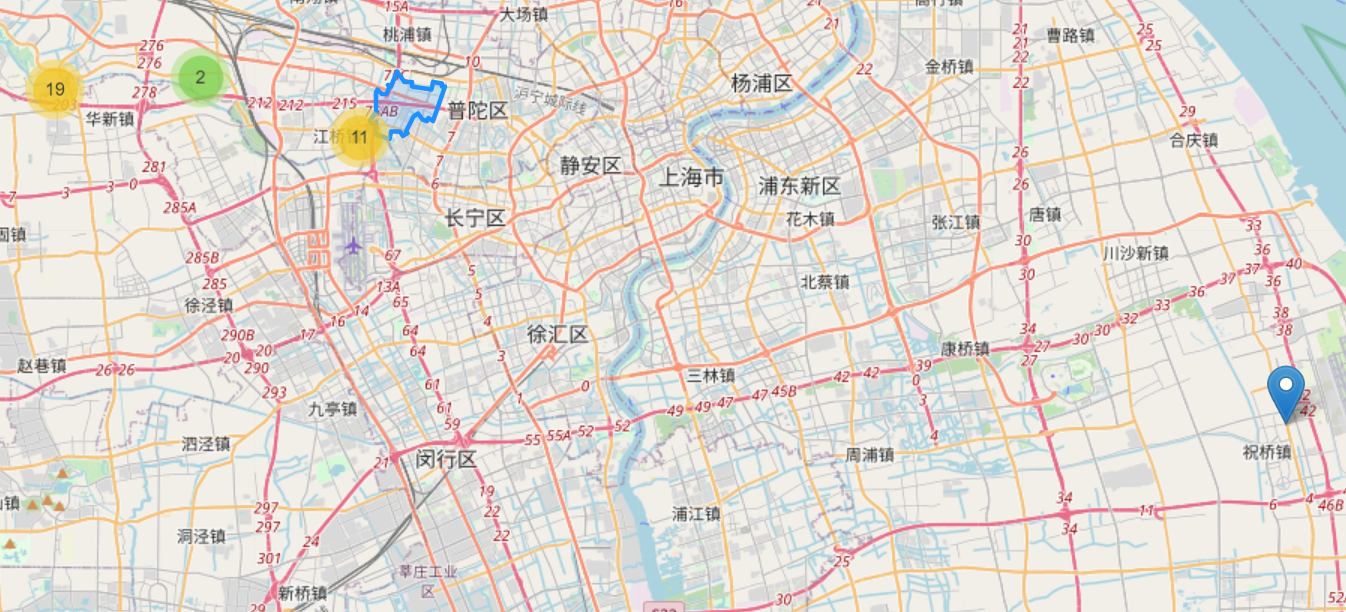
结果示例:
4. 完整代码
import os
import folium
import pandas as pd
import webbrowser as wb
from folium import plugins
import settings

class MapLocation:

    def __init__(self, file_save_path):
        # 描点连线范围文件
        self.df = pd.read_json(settings.JSON_FILE_PATH)
        # 需要展示的地址点
        self.loc_df = pd.read_excel(settings.ADDR_FILE, header=None)
        self.path = file_save_path

    def main_map(self):
        # 初始化
        Map = folium.Map(location=settings.LOCATION,
                         zoom_start=10,
                         attr='default'
                         )
        marker_cluster = plugins.MarkerCluster().add_to(Map)
        for name, row in self.loc_df.iterrows():
            folium.Marker([float(row[1].split(",")[0]), float(row[1].split(",")[1])],
                          popup=folium.Popup(row[0], max_width=1000)).add_to(marker_cluster)

        locations = list(self.df["rings"])
        station = list(self.df["station"])
        for j in range(len(locations)):
            # pandas读出来是str不是list
            str_loc = str(locations[j]).strip('[').strip("'").strip(']')
            location = list()
            for i in range(0, len(str_loc.split(';'))):
                lat = str_loc.split(';')[i].split(',')[0].strip("'")
                lon = str_loc.split(';')[i].split(',')[1].strip("'")
                list1 = [float(lat), float(lon)]
                location.append(list1)
            folium.Polygon(location, popup=folium.Popup(station[j], max_width=1000), tooltip='click here'
                           , color=settings.fill_color.get(station[j])
                           , fill_color=settings.fill_color.get(station[j])
                           , fillOpacity=0.6
                           ).add_to(Map)
        Map.save(self.path)
        wb.open(self.path)


if __name__ == '__main__':
    map = MapLocation(r'd:\\test.html')
    map.main_map()
问题记录
folium.py 文件中_default_js中http://code.jquery.com/jquery-1.12.4.min.js 和https://rawcdn.githack.com/python-visualization/folium/master/folium/templates/leaflet.awesome.rotate.css 文件无法访问导致html渲染失败,打开页面空白
解决方案:
- js文件替换为可用的文件,比如http://libs.baidu.com/jquery/2.0.0/jquery.min.js
- 注释掉不可用的css文件,暂时没找到替代文件