Python——作图
1.Python——作图
百分比堆积柱状图

import matplotlib.pyplot as plt import numpy as np # 定义数据 categories = ['Cat A', 'Cat B', 'Cat C'] values1 = [20, 30, 15] values2 = [10, 25, 20] values3 = [5, 10, 15] # 将数据转化为相对百分比 total = np.array(values1) + np.array(values2) + np.array(values3) percent1 = (np.array(values1) / total) * 100 percent2 = (np.array(values2) / total) * 100 percent3 = (np.array(values3) / total) * 100 # 绘制堆积柱状图 fig, ax = plt.subplots() bar_width = 0.35 index = np.arange(len(categories)) ax.bar(index, percent1, bar_width, label='Value 1') ax.bar(index, percent2, bar_width, bottom=percent1, label='Value 2') ax.bar(index, percent3, bar_width, bottom=percent1 + percent2, label='Value 3') # 添加标签和标题 ax.set_xlabel('Categories') ax.set_ylabel('Percentage') ax.set_title('Stacked Percentage Bar Chart Example') ax.set_xticks(index) ax.set_xticklabels(categories) ax.legend() # 显示图表 plt.show()
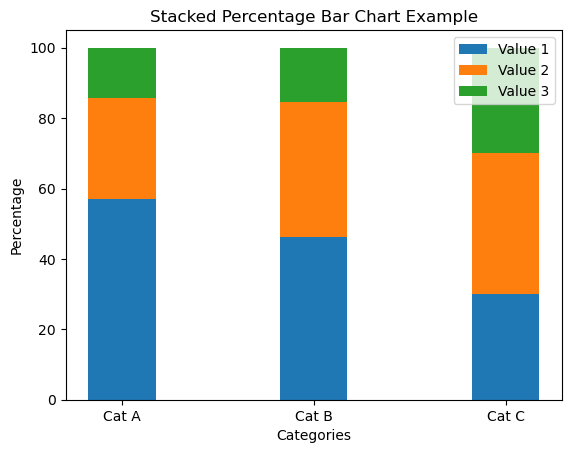
复现效果图:

我们将每个值转换为相对百分比,以便在堆积柱状图中使用。接下来,我们使用matplotlib的 bar 函数绘制了堆积柱状图,并使用 bottom 参数来进行堆积。
百分比柱状堆积图原理上是多个柱状图的堆积, 而bottom参数就是用于改变基准高度的。因此在绘图之前要将数据转换为总体百分比,确保柱状图堆积后高度是一致的。
带有随机扰动的线性拟合可视化

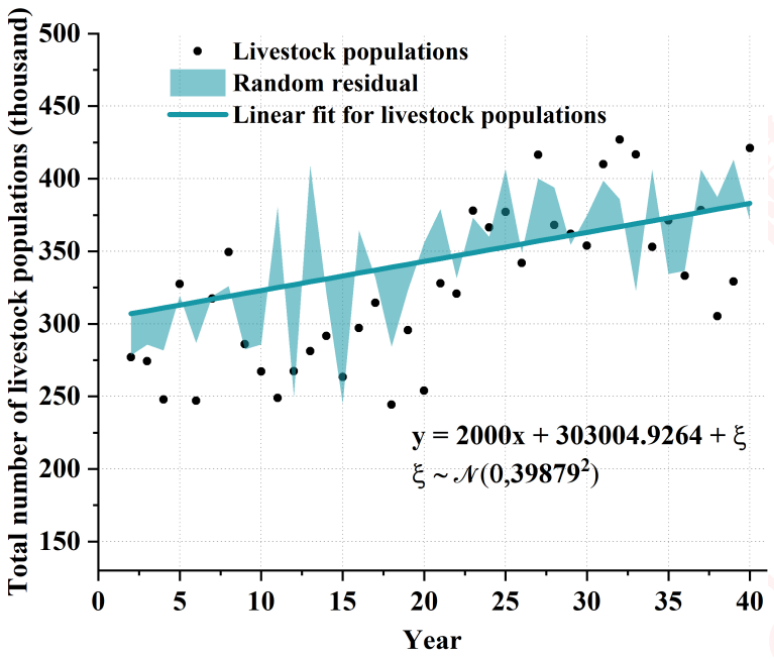
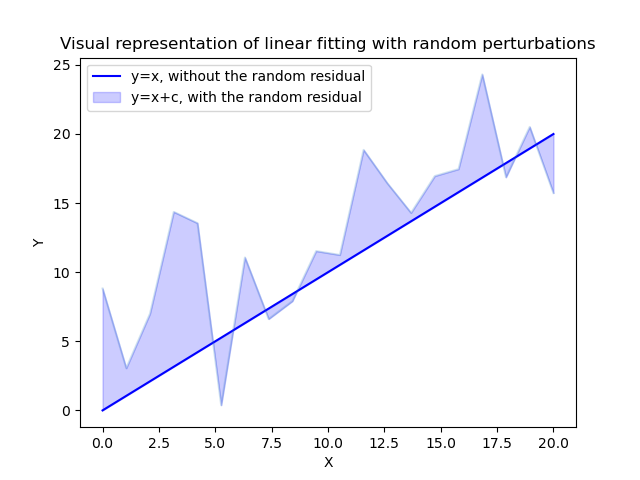
这不是单纯的 linaer fitting 可视化,还加了 正态扰动的 可视化。直线是已经拟合好的曲线,散点是原始数据,带填充的是正态扰动的折线图。所以这幅图上一共由三部分组成:散点、曲线、折线。
如下是复现的代码:
import numpy as np import matplotlib.pyplot as plt # 设置随机种子,保证结果可复现 np.random.seed(0) # 生成正态分布的散点序列 mean = 0 # 均值 std = 5 # 标准差 num_points = 20 # 散点数量 points = np.random.normal(mean, std, size=num_points) x = np.linspace(0, 20, num=20) y1 = x y2 = x + points plt.plot(x, y1, label='y=x, without the random residual', color='blue') plt.plot(x, y2, alpha=0.2) plt.fill_between(x, y1, y2, label='y=x+c, with the random residual', color='blue', alpha=0.2) plt.legend(loc='upper left') plt.title("Visual representation of linear fitting with random perturbations") plt.xlabel('X') plt.ylabel('Y') plt.show()


