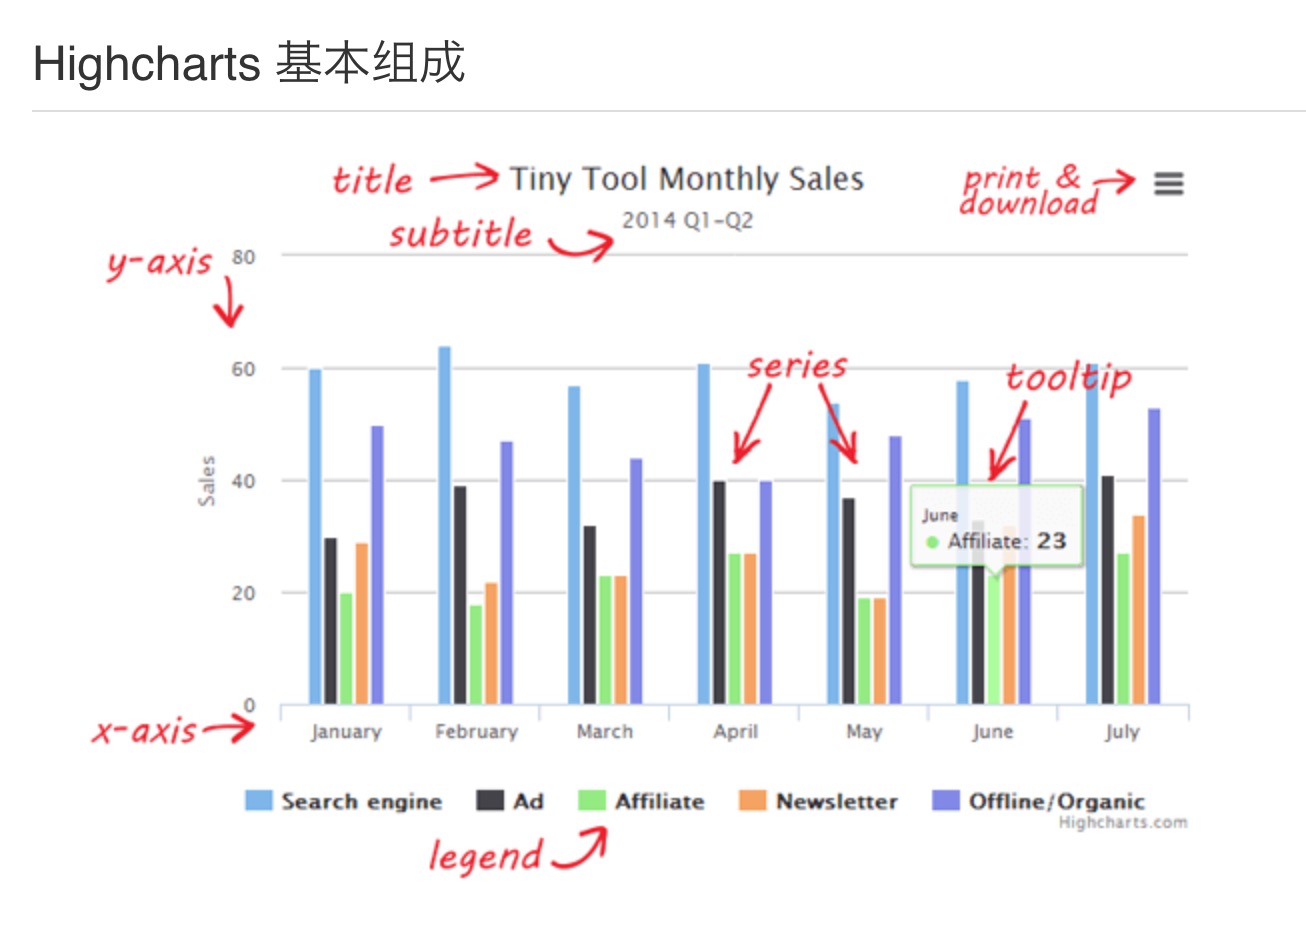
Highcharts基础应用
Highcharts 是一个用纯JavaScript编写的一个图表库。 Highcharts 能够很简单便捷的在web网站或是web应用程序添加有交互性的图表。

官网API文档:https://api.hcharts.cn/highcharts

使用:
首先在页面中引入highcharts.js
html添加图表容器:
<div id="linechart" style="width: 100%;height: 5.8rem" v-show="price_usd.length"></div>

下面👇将用到的数据格式:price_usd和volume: [
      [
             1526366667000, // 时间戳
            739             // 值
        ],
        [
            1526366968000,
            738
        ],
        [
            1526367268000,
            737
        ]]

// 数据处理函数
_handleData(price, volume) {
    let rate = this.rate;
    let priceList = price.map(function (item) {
        let priceArr = [item[0], item[1]];
        priceArr[1] = parseFloat((priceArr[1] * rate).toFixed(5))
        return priceArr;
    });

    let volumeList = volume.map(function (item) {
        let volumeArr = [item[0], item[1]];
        volumeArr[1] = parseInt(volumeArr[1] * rate)
        return volumeArr;
    });

    return {
        priceList: priceList,
        volumeList: volumeList
    }
},

// 接口请求回数据后,绘制图表:
drawGrap() {
                let my = this;
                let data = this._handleData(this.price_usd, this.volume);
                Highcharts.setOptions({ global: { useUTC: false } });
                let chart = Highcharts.chart('linechart', {
                    chart: {
                        zoomType: 'x',
                    },
                    title: {
                        text: ''
                    },

                    xAxis: [
                        {
                            top: '-30%',
                            type: 'datetime',
                            dateTimeLabelFormats: {
                                minute: '%H:%M',
                                hour: '%H:%M',
                                day: '%d. %m月',
                                week: '%d. %m月',
                                month: '%m. %y年',
                                year: '%Y'
                            },
                            lineWidth: 1,
                            lineColor: '#a4a4a4',
                            tickWidth: 0,
                            labels: {
                                style: {color: '#a4a4a4'},
                                // formatter: function () {
                                //     return filter.floorFixPrice(this.value, that.$$coinPrecision);
                                // }
                            },
                        },
                        {
                            lineWidth: 0,
                            lineColor: 'transparent',
                            tickWidth: 0,
                            labels: {
                                enabled: false
                            }
                        }
                    ],
                    tooltip: {
                        useHTML: true,
                        shared: true,
                        animation: true,
                        xDateFormat: '%Y-%m-%d %H:%M:%S',
                        formatter: function () {
                            let pots = this.points;
                            let time = pots[0].x;
                            let price = pots[0].y;

                            let volume = pots[1] ? my.transBigNum(pots[1].y) : '';
                            let tips = '<p style=""><span style="display: block; color:#4e4e4e;font-size:12px; transform: scale(0.9); margin-left: -8px">' + Highcharts.dateFormat('%Y-%m-%d %H:%M', time) + '</span>';
                            tips += '<span style="display: flex; align-items: center; color:#000;font-size:12px;"><i style="display: inline-block; margin-right: 4px; width: 6px; height: 6px; border-radius: 50%; background-color: #2c8dff"></i>价格 (人民币): ' + price + '</span>';
                            tips += '<span style="display: flex; align-items: center; color:#000;font-size:12px;"><i style="display: inline-block; margin-right: 4px; width: 6px; height: 6px; border-radius: 50%; background-color: #777"></i>24h 成交量: ' + volume + ' CNY</span>';

                            tips += '</p>';
                            return tips;
                        }
                    },
                    yAxis: [
                        {
                            top: '5%',
                            height: '65%',
                            title: {
                                text: null
                            },
                            opposite: true,
                            lineWidth: 0,
                            labels: {
                                style: {color: '#2c8dff'},
                            },
                            gridLineWidth: 1,
                            gridLineColor: '#eee',
                        },
                        {
                            top: '85%',
                            height: '20%',
                            title: {text: null, style: {color: '#4a596b'}},
                            labels: {
                                enabled: false
                            },
                            gridLineWidth: 1,
                            gridLineColor: '#f5f5f5',
                        }],
                    legend: {
                        enabled: false
                    },
                    plotOptions: {
                        area: {
                            fillColor: '#d5e8ff',
                            marker: {
                                radius: 2
                            },
                            lineWidth: 1,
                            states: {
                                hover: {
                                    lineWidth: 1
                                }
                            },
                            threshold: null
                        },
                        series: {
                            lineWidth: 1,
                        }
                    },
                    series: [
                        {
                            type: 'area',
                            animation: true,
                            name: '价格(人民币)',
                            data: data.priceList,
                            color: '#2c8dff',
                        },
                        {
                            type: 'area',
                            animation: true,
                            name: '24h 成交量',
                            yAxis: 1,
                            data: data.volumeList,
                            color: '#2c8dff',
                            lineWidth: 0,
                            tooltip: {
                                valueSuffix: ' CNY'
                            }
                        }],
                    credits: {
                        enabled: false
                    }
                });
            }
绘制出来的图如下:


 浙公网安备 33010602011771号