Python-sklearn初步实践
Python-sklearn实践
1 sklearn实践
Python有关于机器学习的库sklearn,我们可以使用sklearn来快速得到想要的机器学习算法,它不仅包括了很多学习算法,还包含了预处理、微调和评估模型等实用的函数。
我们可以调用sklearn中自带的数据集:
from sklearn import datasets
import numpy as np

iris = datasets.load_iris()
#读取鸢尾花数据集中的所有样本,只要两个特征
X = iris.data[:, [2,3]]
y = iris.target
np.unique(y)
array([0, 1, 2])
上面我们读取了sklearn自带的鸢尾花数据集,数据集中有三个种类,在iris中以整数(0, 1, 2)存储。虽然也可以使用字符串类型存储种类,但是使用数字存储不仅可以避免技术故障,而且所占内存小可以提高计算性能。
下面我们将数据集分为训练集和测试集:
from sklearn.model_selection import train_test_split
X_train, X_test, y_train, y_test = train_test_split(X, y, test_size=0.3, random_state=1, stratify=y)
形式:train_test_split(train_data, train_target, test_size=None, train_size=None, random_state=None, shuffle=True, stratify=None)
参数解释:
- train_data:样本特征集 接受列表list, 数组numpy arrays, 矩阵scipy-sparse matrices, 以及pandas dataframes
- train_target:样本分类集 接受种类和上面一样
- test_size:测试集所占比例,若是整数则是样本的数量
- train_size:训练集所占比例,若是整数则是样本的数量
- random_state:随机种子,数据集的划分是随机的,若要进行重复实验需要设置随机种子,确保下次实验时,划分相同。
- shuffle:是否随机划分,默认随机
- stratify:如果不是“无”,则以分层方式拆分数据,将其用作类标签。分层意味着调用train_test_split方法可以返回与输入数据集的分类标签相同比例的训练和测试子集
我们通过train_test_split函数将数据集分为了测试集和训练集,其中30%为测试集,70%为训练集。
通过定义stratify=y获得内置的分层支持:
np.bincount(y)
array([50, 50, 50], dtype=int64)
np.bincount(y_train)
array([35, 35, 35], dtype=int64)
np.bincount(y_test)
array([15, 15, 15], dtype=int64)
可以看出划分出的数据每类的比例和原始数据相同。
接下来通过sklearn标准化数据:
from sklearn.preprocessing import StandardScaler
#实例化标准化类
sc = StandardScaler()
sc.fit(X_train)
X_train_std = sc.transform(X_train)
X_test_std = sc.transform(X_test)
在使用StandardScaler时,必须先通过fit函数训练出数据的方差和均值,测试集X_test也必须要进行和X_train相同的变换。
下面使用sklearn中自带的感知机处理数据,sklearn中的学习算法默认支持多分类。
from sklearn.linear_model import Perceptron

ppn = Perceptron(max_iter=40, eta0=0.1, random_state=1)
ppn.fit(X_train_std, y_train)
y_pred = ppn.predict(X_test_std)
(y_test != y_pred).sum()
"""
输出:
1
"""
注意,本次使用的sklearn是1.0.2在很多地方使用的是0.17、0.18的,他们使用的
Perceptron中是有n_iter参数的,但是该参数在0.21版本中已经去除了,想指定训练epoch,可以使用max_iter参数来代替。n_iter_no_change应该也可以。
执行最后输出误分类的个数为1,查看感知器的分类准确度:
from sklearn.metrics import accuracy_score
accuracy_score(y_test, y_pred)
#输出:
0.9777777777777777
也可以使用Perceptron中自带的评价函数:
ppn.score(X_test_std, y_test)
#输出:
0.9777777777777777
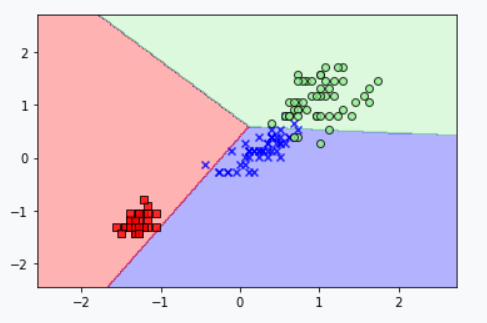
现在我们来查看分类边界,可以对上一篇博客中的plot_decision_regions进行更改绘制新的决策边界。
import matplotlib.pyplot as plt
from matplotlib.colors import ListedColormap

def plot_decision_regions(X, y, classifier, test_idx=None, resolution=0.02):
    markers = ('s', 'x', 'o', '^', 'v')
    colors = ('red', 'blue', 'lightgreen', 'gray', 'cyan')
    #创建色度图,每类一种颜色
    cmap = ListedColormap(colors[:len(np.unique(y))])
    #设置网格图中的每个点xx1为x坐标,xx2为y坐标
    x1_min, x1_max = X[:, 0].min() - 1, X[:, 0].max() + 1
    x2_min, x2_max = X[:, 1].min() - 1, X[:, 1].max() + 1
    xx1, xx2 = np.meshgrid(np.arange(x1_min, x1_max, resolution),
                           np.arange(x2_min, x2_max, resolution))
    #通过训练好的模型对图中每个点进行分类
    Z = classifier.predict(np.array([xx1.ravel(), xx2.ravel()]).T)
    #xx1.shape为(305, 235)就是网图中点的个数
    Z = Z.reshape(xx1.shape)
    #图中颜色会随z值变化,alpha是透明度
    plt.contourf(xx1, xx2, Z, alpha=0.3, cmap=cmap)
    #设置x轴和y轴的范围
    plt.xlim(xx1.min(), xx1.max())
    plt.ylim(xx2.min(), xx2.max())
    #遍历每个y类(实际就两类)idx表示在数组np.unique(y)中的坐标,cl表示数组np.unique(y)中的值
    for idx, cl in enumerate(np.unique(y)):
        plt.scatter(x=X[y == cl, 0],
                    y=X[y == cl, 1],
                    alpha=0.8,
                    c=colors[idx],
                    marker=markers[idx],
                    label=cl,
                    edgecolor='black')
    if test_idx:
    # plot all samples
        X_test, y_test = X[test_idx, :], y[test_idx]
        plt.scatter(X_test[:, 0],
                    X_test[:, 1],
                    c='',
                    edgecolor='black',
                    alpha=1.0,
                    linewidth=1,
                    marker='o',
                    s=100,
                    label='test set')
X_combined_std = np.vstack((X_train_std, X_test_std))
y_combined = np.hstack((y_train, y_test))

plot_decision_regions(X=X_combined_std, y=y_combined,
                      classifier=ppn, test_idx=range(105, 150))
plt.xlabel('petal length [standardized]')
plt.ylabel('petal width [standardized]')
plt.legend(loc='upper left')

plt.tight_layout()
#plt.savefig('images/03_01.png', dpi=300)
plt.show()

上图可知,三种花不能被线性决策边界完全分离。
参考
- [1] Sebastian Raschka. Python机器学习(第2版)[M]. 机械工业出版社, 2017.


