对微博热搜数据的处理
项目要求
对微博热搜数据利用结巴分词和词云工具进行分析和可视化展示,进一步了解自然语言的处理工具,学会对语料库进行分析。
(一) 针对微博数据中的主题为“疫情”的微博,对其“热搜内容”进行分词,计算词出现的次数,将出现次数前20名的动词输出,将出现次数前20名的名词输出,并采用“词云”可视化输出(可以定义多个时间段,看舆情的变化)
(二) 针对微博数据中的主题为“政府”的微博,对其“热搜内容”进行分词,计算词出现的次数,将出现次数前20名的动词输出,将出现次数前20名的名词输出,并采用“词云”可视化输出。(可以定义多个时间段,看随着时间的舆情变化)
(三)提示:用结巴分词工具(jieba)分词和用“pycloud”或“wordcloud”做词云;分词中考虑到在词典中要自己添加下新词:如:“火神山”。
数据集情况介绍
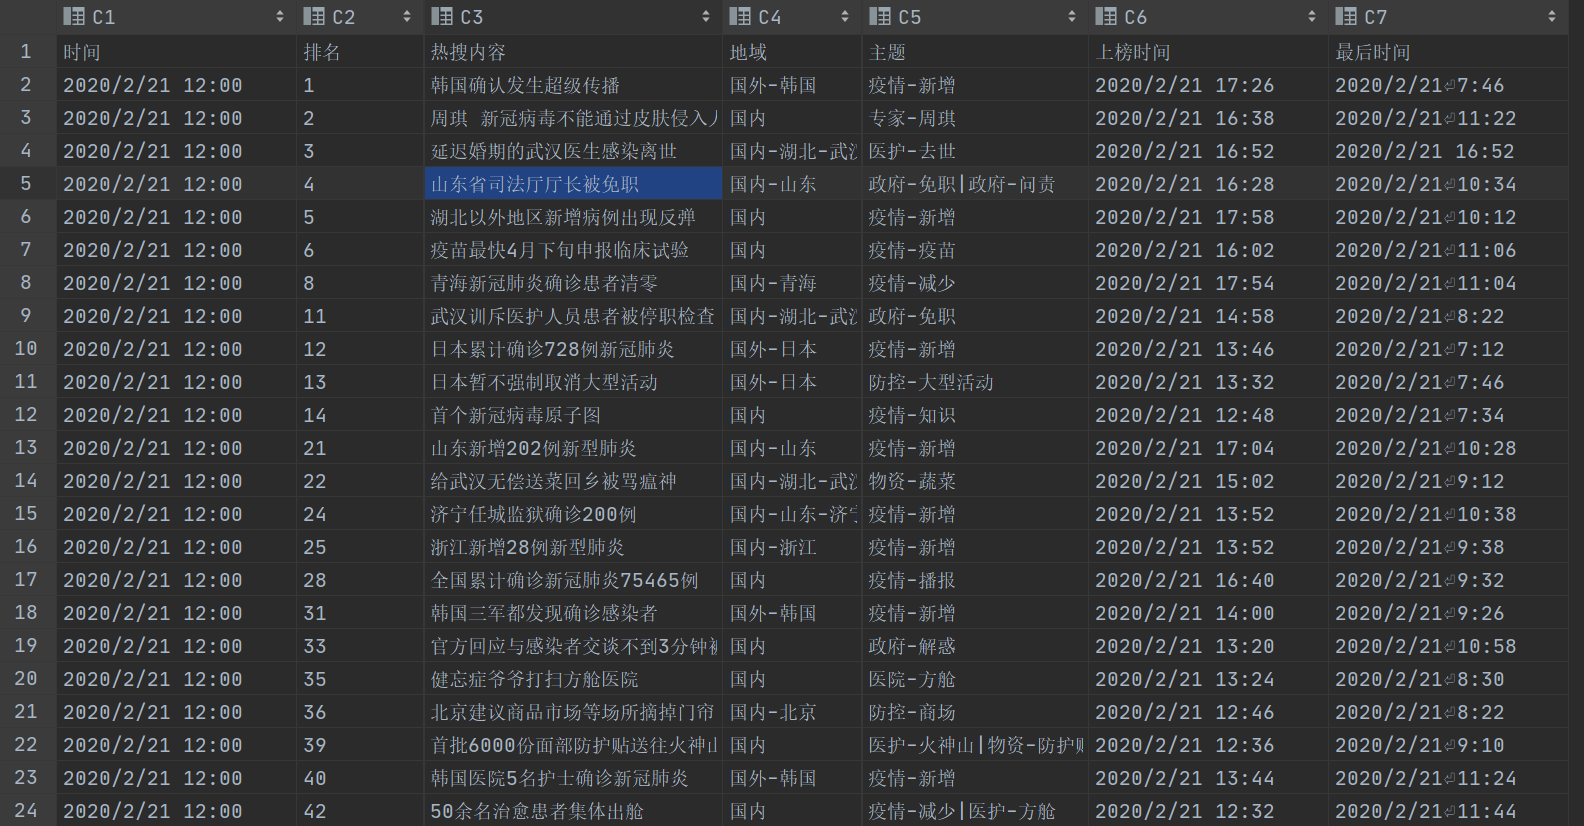
一共有896条热搜,其中每一条热搜有时间、排名、热搜内容、地域、主题、上榜时间、最后时间,这几项内容。
根据项目要求,有用的内容是:热搜内容、主题、上榜时间、最后时间。
根据数据集以及项目要求,现确定基本思路是,先用分割热搜内容,提取出字典,再根据主题分类,接着判断动名词,然后判断判断时间是否在时间范围内,更新字典,提取出前20个词,最后根据字典形成词云。
代码实现和分析
-
使用到的库函数
import numpy as np                                 ##数据存取使用
import pandas as pd                                ##数据存取使用
import jieba                                       ##分词使用
import jieba.posseg                                ##按照动名词划分时使用
import re                                          ##正则匹配时使用
from wordcloud import WordCloud                    ##词云图使用
import matplotlib.pyplot as plt                    ##绘制图形时使用
一些库的链接(待补)
-
读取数据集
filename='weibo.csv'
f1=pd.read_csv(filename,usecols=['热搜内容','主题','上榜时间','最后时间'])
list=f1.values.tolist()
data=np.array(list)
data1=[]
data2=[]
这里需要的是热搜内容、主题、上榜时间、最后时间这几项,所以只选择这几项来读取。
读取完成后是pd.read的标准形式,不方便调用,所以这里再转成列表,通过数组的形式来使用。
data1与data2是之后要使用的数组名称,这里提前定义下 -
生成字典函数
def vocabulary(array,s):       ##参数array是生成的列表,s是需要得到词典词的类型,如:动词=‘v’,名词=‘n’

	vocabulary = {}
	Word=[]                            ##定义分词结果列表
	for i in range(len(array)):
    	wordlist=jieba.posseg.cut(array[i][0])  ##此处使用的jieba分词是分割成字典,字典内容有word与flag,详细说明见jiaba库的说明。
    	for word,flag in wordlist:
        	match4=re.search(s,flag)     ##re库的使用,详细解释见re库
        	if match4 !=None:
            	Word.append(word)
    	for j in range(len(Word)):
        	if Word[j] in vocabulary:
            	vocabulary[Word[j]]+=1
        	else:
            	vocabulary[Word[j]]=1

	return vocabulary
这个函数的整体思路是通过输入要分割的数组和词性来得到一个词典。
-
得到列表(data1,data2)
for i in range(len(data)):

	Time='2020/2'       #定义所取时间段
	TimeMatch=0

	m_match1=re.search('疫情',data[i][1])      #按主题匹配
	m_match2=re.search('政府',data[i][1])
	TimeMatch1=re.search(Time,data[i][2])      #按时间匹配
	TimeMatch2=re.search(Time,data[i][3])

	if TimeMatch1 !=None or TimeMatch2 != None:
    	TimeMatch = 1
	if m_match1 != None and TimeMatch == 1:
    	data1.append(data[i])
	if m_match2 !=None and TimeMatch == 1:
    	data2.append(data[i])
时间和主题都匹配时按照主题分成data1与data2两个列表,用作vocabulary函数的参数
-
生成词典与词云图
N='n'
V='v'

Vocabulary1=vocabulary(data1,N)
Vocabulary2=vocabulary(data1,V)
Vocabulary3=vocabulary(data2,N)
Vocabulary4=vocabulary(data2,V)

wordcloud1 = WordCloud(font_path='simhei.ttf',background_color="white",width =3000,height= 2000,margin= 10,max_words=20 ).fit_words(Vocabulary1)
wordcloud2 = WordCloud(font_path='simhei.ttf',background_color="white",width =3000,height= 2000,margin= 10,max_words=20).fit_words(Vocabulary2)
wordcloud3 = WordCloud(font_path='simhei.ttf',background_color="white",width =3000,height= 2000,margin= 10,max_words=20).fit_words(Vocabulary3)
wordcloud4 = WordCloud(font_path='simhei.ttf',background_color="white",width =3000,height= 2000,margin= 10,max_words=20).fit_words(Vocabulary4)

plt.imshow(wordcloud1)
plt.show()
plt.imshow(wordcloud2)
plt.show()
plt.imshow(wordcloud3)
plt.show()
plt.imshow(wordcloud4)
plt.show()
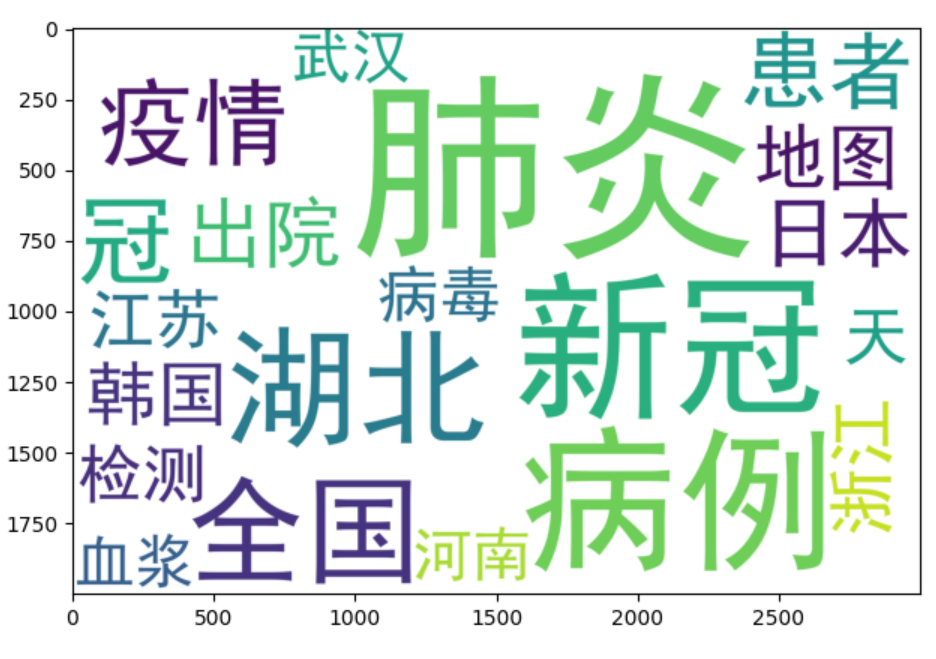
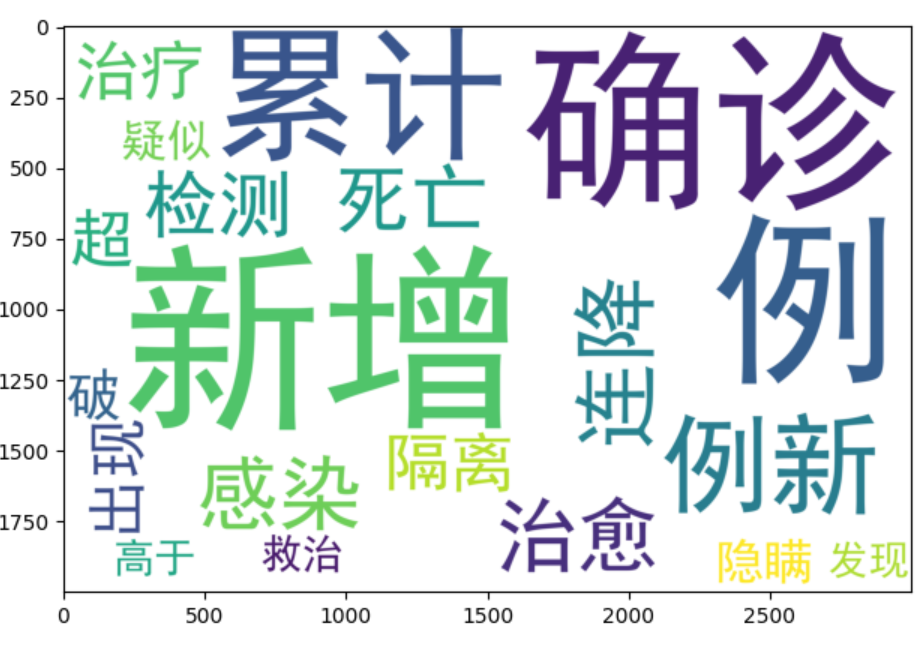
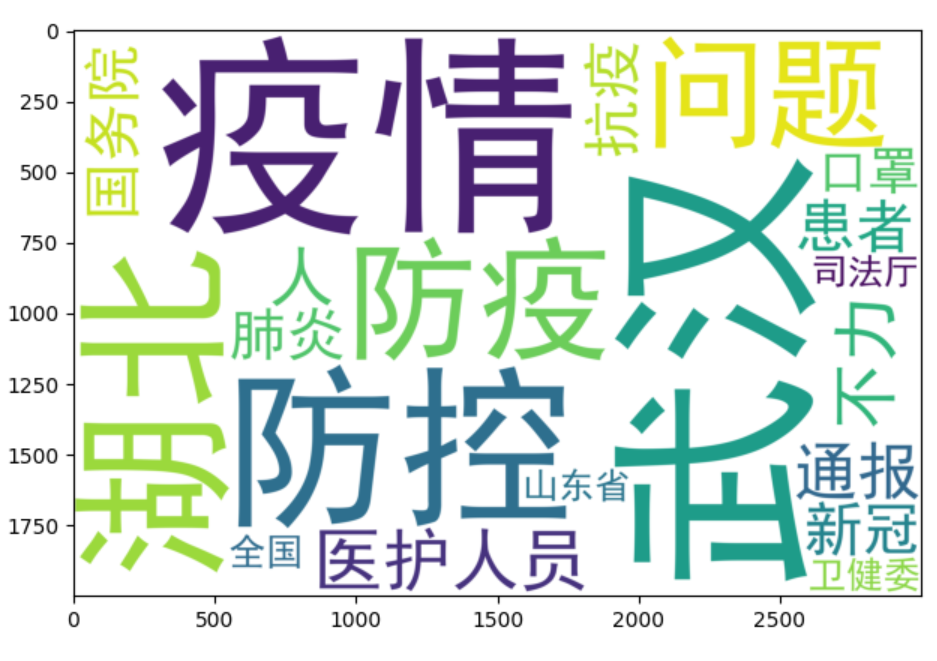
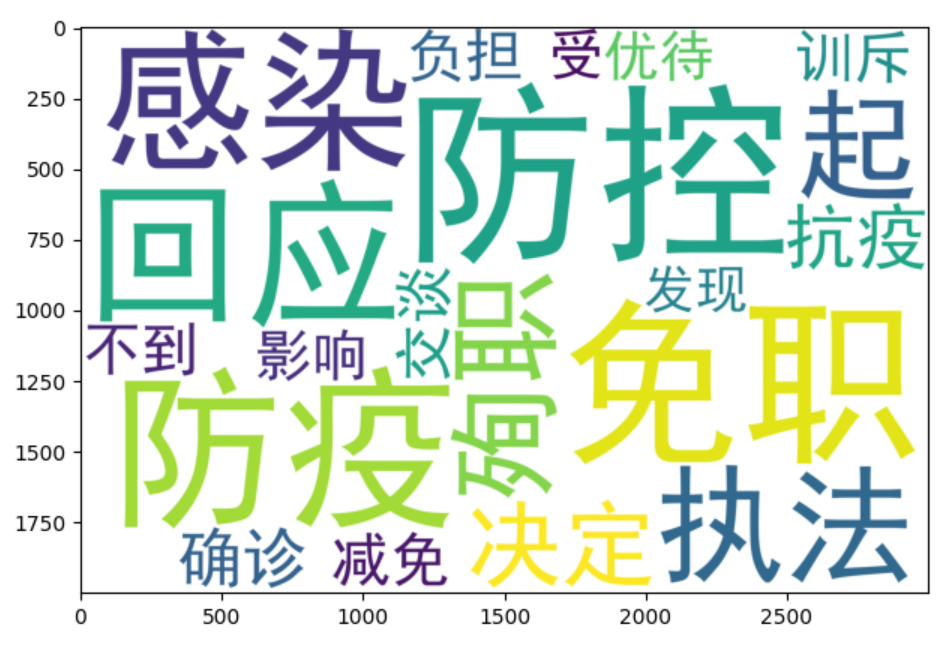
这里主要生成了4个词云图,分别是:①主题为政府,时间在2020年2月,名词词云;②主题为政府,时间为2020年2月,动词词云;③主题为疫情,时间在2020年2月,名词词云;④主题为疫情,时间在2020年2月,动词词云。
-
改进思路
目前对于时间匹配的操作是和主题匹配的模式相同的,只能按照月份来进行分类,为了更好的体现词云的变化,可以改成按星期来显示,这一点需要用到正则匹配的知识。
-
附上全部代码
点击查看代码
import numpy as np
import pandas as pd
import jieba
import jieba.posseg
import re
from wordcloud import WordCloud
import matplotlib.pyplot as plt

filename='weibo.csv'
f1=pd.read_csv(filename,usecols=['热搜内容','主题','上榜时间','最后时间'])

list=f1.values.tolist()
data=np.array(list)
data1=[]
data2=[]


def vocabulary(array,s):

    vocabulary = {}
    Word=[]
    for i in range(len(array)):
        wordlist=jieba.posseg.cut(array[i][0])
        for word,flag in wordlist:
            match4=re.search(s,flag)
            if match4 !=None:
                Word.append(word)
        for j in range(len(Word)):
            if Word[j] in vocabulary:
                vocabulary[Word[j]]+=1
            else:
                vocabulary[Word[j]]=1
    return vocabulary


for i in range(len(data)):

    Time='2020/2'
    TimeMatch=0

    m_match1=re.search('疫情',data[i][1])
    m_match2=re.search('政府',data[i][1])
    TimeMatch1=re.search(Time,data[i][2])
    TimeMatch2=re.search(Time,data[i][3])

    if TimeMatch1 !=None or TimeMatch2 != None:
        TimeMatch = 1
    if m_match1 != None and TimeMatch == 1:
        data1.append(data[i])
    if m_match2 !=None and TimeMatch == 1:
        data2.append(data[i])

N='n'
V='v'

Vocabulary1=vocabulary(data1,N)
Vocabulary2=vocabulary(data1,V)
Vocabulary3=vocabulary(data2,N)
Vocabulary4=vocabulary(data2,V)

wordcloud1 = WordCloud(font_path='simhei.ttf',background_color="white",width =3000,height= 2000,margin= 10,max_words=20 ).fit_words(Vocabulary1)
wordcloud2 = WordCloud(font_path='simhei.ttf',background_color="white",width =3000,height= 2000,margin= 10,max_words=20).fit_words(Vocabulary2)
wordcloud3 = WordCloud(font_path='simhei.ttf',background_color="white",width =3000,height= 2000,margin= 10,max_words=20).fit_words(Vocabulary3)
wordcloud4 = WordCloud(font_path='simhei.ttf',background_color="white",width =3000,height= 2000,margin= 10,max_words=20).fit_words(Vocabulary4)

plt.imshow(wordcloud1)
plt.show()
plt.imshow(wordcloud2)
plt.show()
plt.imshow(wordcloud3)
plt.show()
plt.imshow(wordcloud4)
plt.show()


【推荐】国内首个AI IDE,深度理解中文开发场景,立即下载体验Trae
【推荐】编程新体验,更懂你的AI,立即体验豆包MarsCode编程助手
【推荐】抖音旗下AI助手豆包,你的智能百科全书,全免费不限次数
【推荐】轻量又高性能的 SSH 工具 IShell:AI 加持,快人一步
· Manus重磅发布:全球首款通用AI代理技术深度解析与实战指南
· 被坑几百块钱后,我竟然真的恢复了删除的微信聊天记录!
· 没有Manus邀请码?试试免邀请码的MGX或者开源的OpenManus吧
· 园子的第一款AI主题卫衣上架——"HELLO! HOW CAN I ASSIST YOU TODAY
· 【自荐】一款简洁、开源的在线白板工具 Drawnix