结果可视化——Matplotlib.pyplot
Matplotlib.pyplot总结
经常看到这样一行代码
import matplotlib.pyplot as plt
这个plt,其实大有来头,它集成了画图的很多方便函数,使用起来也能够结合numpy,list等工具。
基本用法
我们可以从一张画布开始。
fig, axes = plt.subplots()
fig是画板,axes是画布,如果subplots有参数控制多个画布,axes可以迭代。
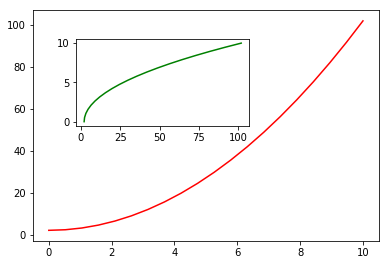
fig = plt.figure()  # 新建画板
axes1 = fig.add_axes([0.1, 0.1, 0.8, 0.8])  # 大画布
axes2 = fig.add_axes([0.2, 0.5, 0.4, 0.3])  # 小画布

axes1.plot(x, y, 'r')  # 大画布
axes2.plot(y, x, 'g')  # 小画布
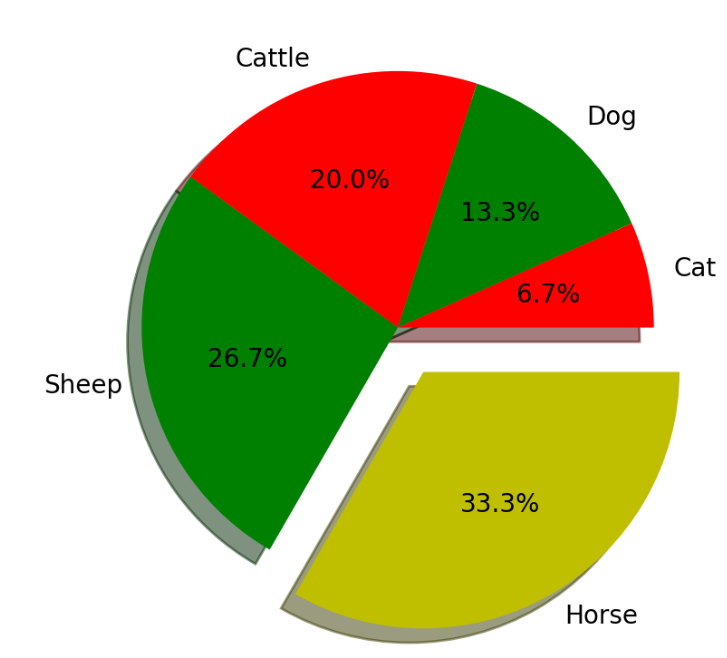
饼图
label = 'Cat', 'Dog', 'Cattle', 'Sheep', 'Horse'  # 各类别标签
color = 'r', 'g', 'r', 'g', 'y'  # 各类别颜色
size = [1, 2, 3, 4, 5]  # 各类别占比
explode = (0, 0, 0, 0, 0.2)  # 各类别的偏移半径
axes.pie(size, colors=color, explode=explode, labels=label, shadow=True, autopct='%1.1f%%')
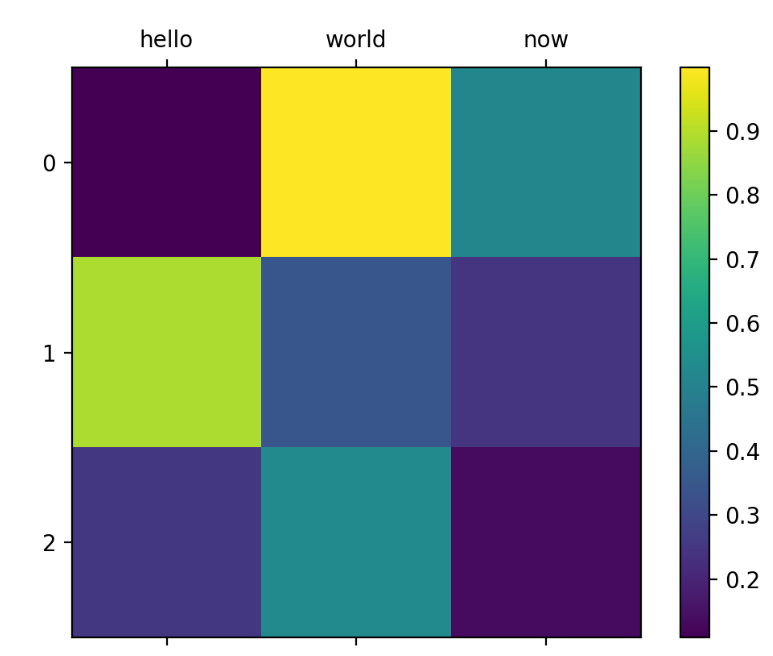
colorbar
arr = np.random.random([3, 3])
cx = axes.matshow(arr)
fig.colorbar(cx)
axes.set_xticklabels([''] + ["hello", "world", "now"])
等高线
# 生成网格矩阵
x = np.linspace(-5, 5, 500)
y = np.linspace(-5, 5, 500)
X, Y = np.meshgrid(x, y)
# 等高线计算公式
Z = (1 - X / 2 + X ** 3 + Y ** 4) * np.exp(-X ** 2 - Y ** 2)

plt.contourf(X, Y, Z)

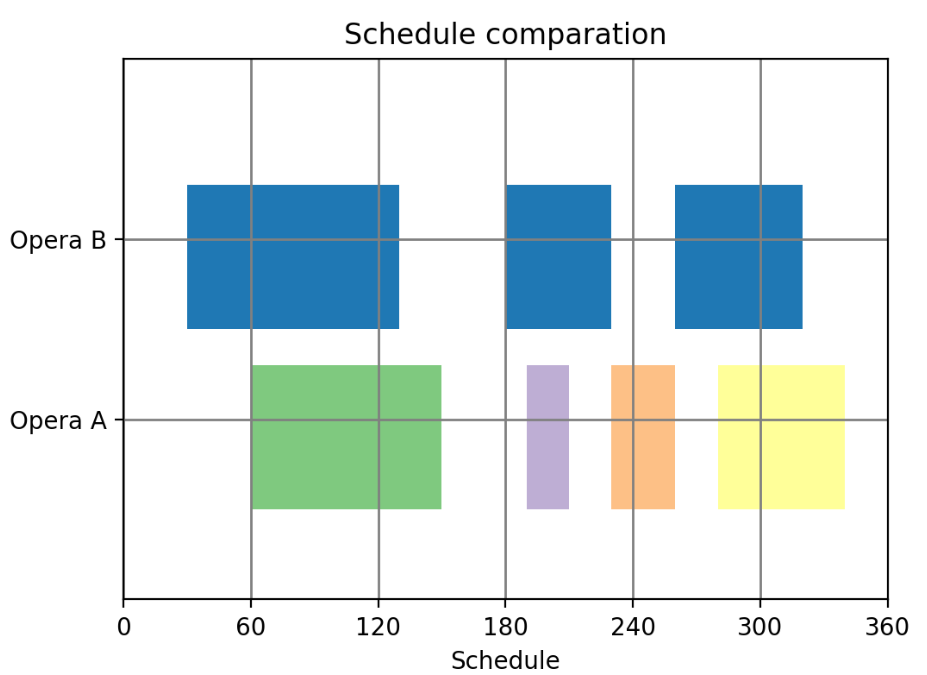
间断直方图
import matplotlib.pyplot as plt
import numpy as np
plt.xlim(0, 360)
plt.ylim(5, 35)
plt.xlabel("Schedule")

plt.xticks(np.arange(0, 361, 60))
plt.yticks([15, 25], ["Opera A", "Opera B"])

plt.grid(ls="-", lw=1, color="gray")

plt.title("Schedule comparation")
plt.broken_barh([(30, 100), (180, 50), (260, 60)], (20, 8), facecolors="#1f78b4")
plt.broken_barh([(60, 90), (190, 20), (230, 30), (280, 60)], (10, 8), facecolors=(
        "#7fc97f", "#beaed4", "#fdc086", "#ffff99"))
plt.show()
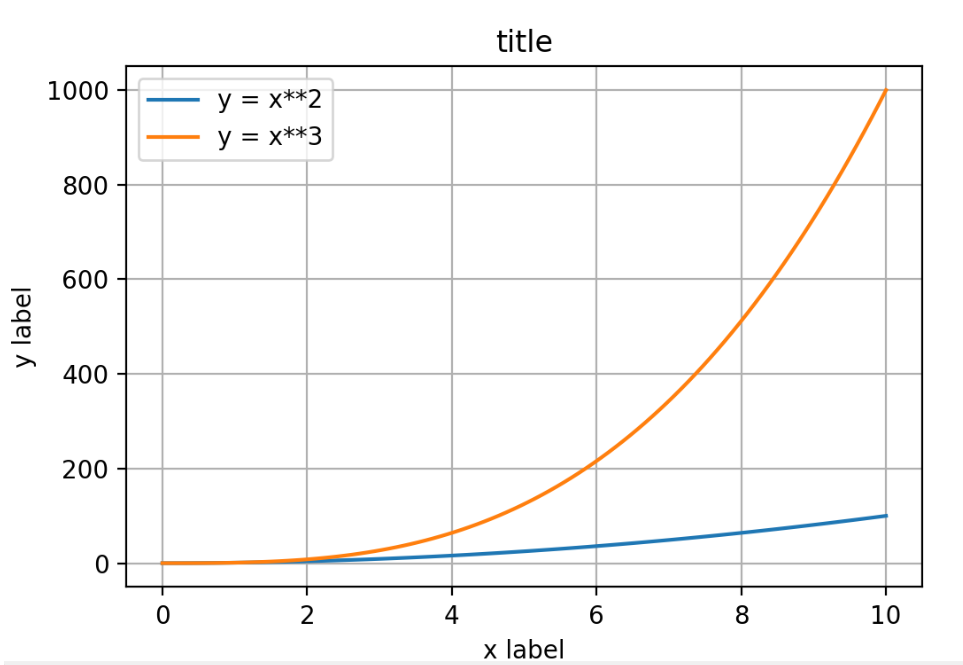
作图规范
添加图标题,图例,网格。
fig, axes = plt.subplots()

axes.set_xlabel('x label')  # 横轴名称
axes.set_ylabel('y label')
axes.set_title('title')  # 图形名称

axes.plot(x, x**2)
axes.plot(x, x**3)
axes.legend(["y = x**2", "y = x**3"], loc=0)  # 图例
axes.grid(True)
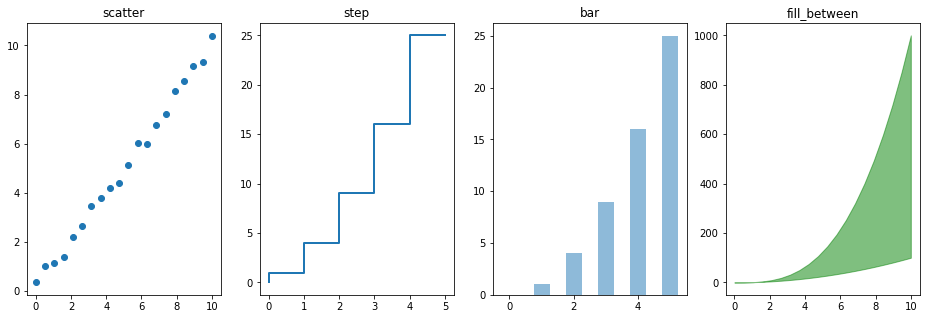
其他图形
n = np.array([0, 1, 2, 3, 4, 5])

fig, axes = plt.subplots(1, 4, figsize=(16, 5))

axes[0].scatter(x, x + 0.25*np.random.randn(len(x)))
axes[0].set_title("scatter")

axes[1].step(n, n**2, lw=2)
axes[1].set_title("step")

axes[2].bar(n, n**2, align="center", width=0.5, alpha=0.5)
axes[2].set_title("bar")

axes[3].fill_between(x, x**2, x**3, color="green", alpha=0.5)
axes[3].set_title("fill_between")
参考教程
一个人没有梦想,和咸鱼有什么区别!

 浙公网安备 33010602011771号