PyPlot 绘图
matplotlib的安装
!pip install matplotlib

import matplotlib
print(matplotlib.__version__) #查看版本
import matplotlib.pyplot as plt
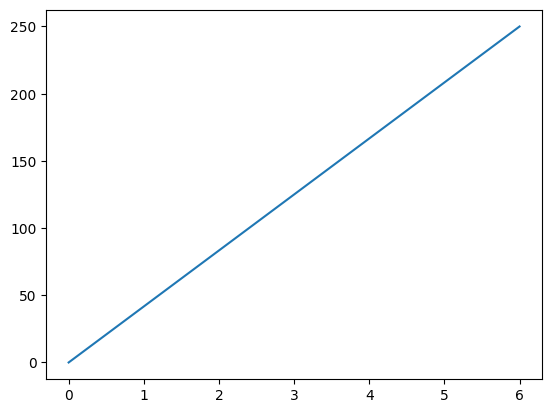
# 在图中从0 0 到 6 250 画一条直线   默认绘制直线
import numpy as np

xpoints = np.array([0,6])  # 注意是两个x坐标值
ypoints = np.array([0,250])

plt.plot(xpoints , ypoints)
plt.show()
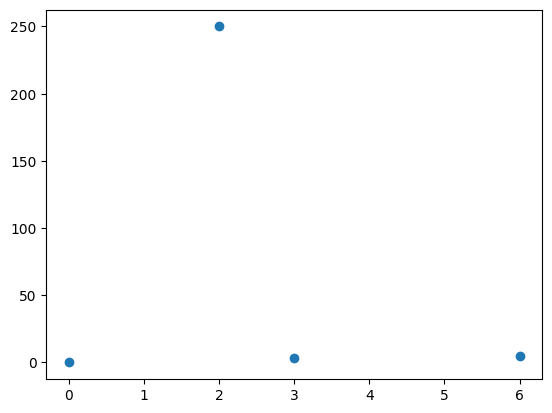
# 无线绘图仅仅绘制标记 传入 ‘o’  多点
# import numpy as np

# xpoints = np.array([0,6])  # 注意是两个x坐标值
# ypoints = np.array([0,250])

# plt.plot(xpoints , ypoints , 'o')
# plt.show()

import numpy as np

# xpoints = np.array([0,2,3,6])  # 注意是两个x坐标值  如果没有给定x的值那么默认值是升序 0  1 2 3 ....
ypoints = np.array([0,250,3,5])

plt.plot(xpoints , ypoints , 'o')  # 想要采取默认值那么要把xpoints参数去掉 绘制折线图就是去掉‘o’
plt.show()
标记 marker
import numpy as np

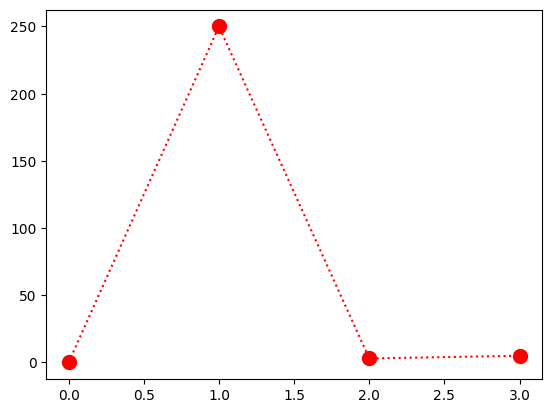
ypoints = np.array([0,250,3,5])

plt.plot(ypoints , 'o:r' ,ms = 10)   # 标记的点是圆 o     marker | line | color   ms 是 markersize
plt.show()

# mec 是边缘的颜色 mfc 是边缘内的颜色
线条
import numpy as np
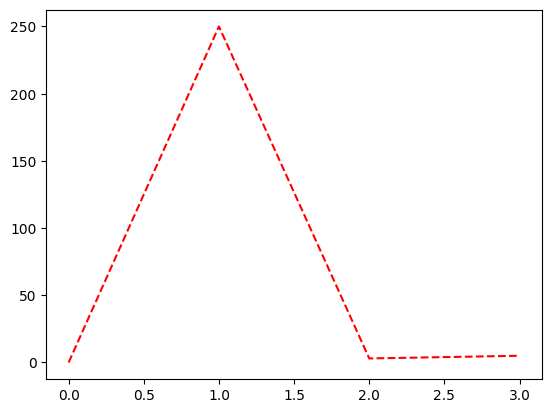
ypoints = np.array([0,250,3,5])
plt.plot(ypoints , linestyle = 'dashed' , c = "red") #或者dotted 或者简洁写法 ls = ':' 虚线 '-.'虚实结合 点划线
plt.show()
# 设置颜色用 c = "red" 线的宽度 lw = "20"
# 多条线
plt.plot(y1)
plt.plot(y2)


# 一对一对出现
plt.plot(x1,y1,x2,y2)
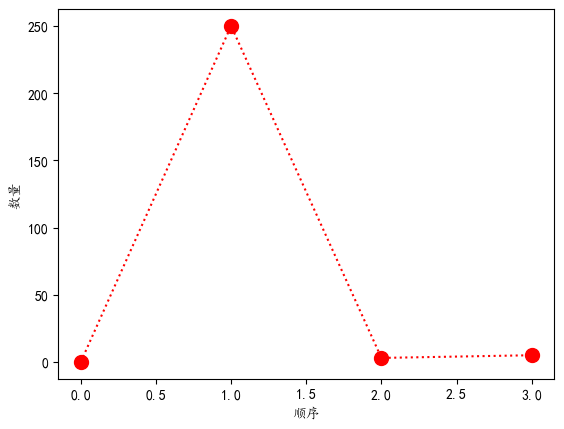
绘制标签
matplotlib.rcParams['font.sans-serif'] = ['KaiTi']

ypoints = np.array([0,250,3,5])

plt.plot(ypoints , 'o:r' ,ms = 10)
# 设置标签
plt.xlabel("顺序");
plt.ylabel("数量")
plt.show()
绘制标题
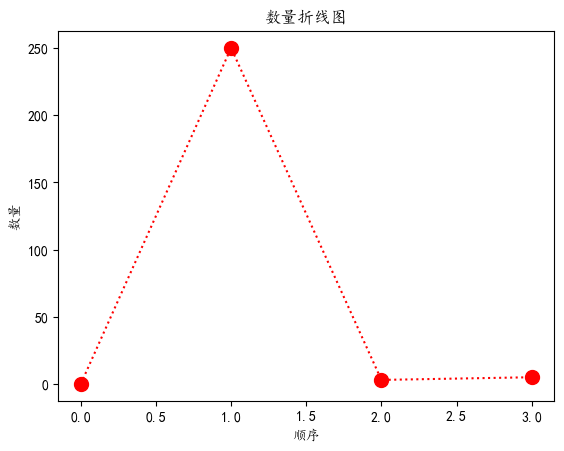
matplotlib.rcParams['font.sans-serif'] = ['KaiTi']

ypoints = np.array([0,250,3,5])

plt.plot(ypoints , 'o:r' ,ms = 10)
# 设置标签
plt.title("数量折线图")
plt.xlabel("顺序");
plt.ylabel("数量")
plt.show()
设置标题和标签的字体属性
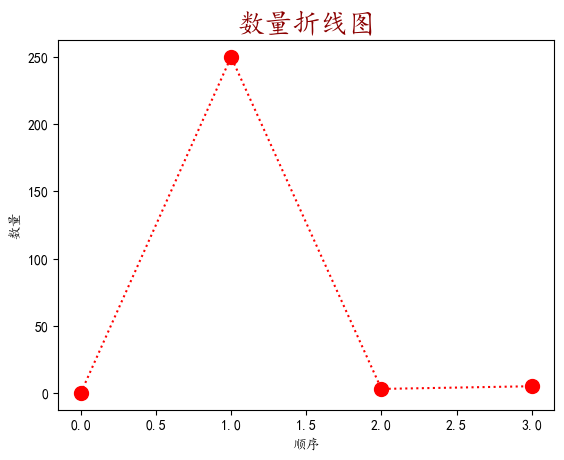
matplotlib.rcParams['font.sans-serif'] = ['KaiTi']

ypoints = np.array([0,250,3,5])

# 设置字体属性
font1 = {'family' : 'sans-serif' , 'color' : 'darkred' , 'size' : 20 }


plt.plot(ypoints , 'o:r' ,ms = 10)
# 设置标签
plt.title("数量折线图" , fontdict = font1)
plt.xlabel("顺序");
plt.ylabel("数量")
plt.show()

# 定位标题位置 在title中设置loc = 'left' 默认是center
为图像添加网格线
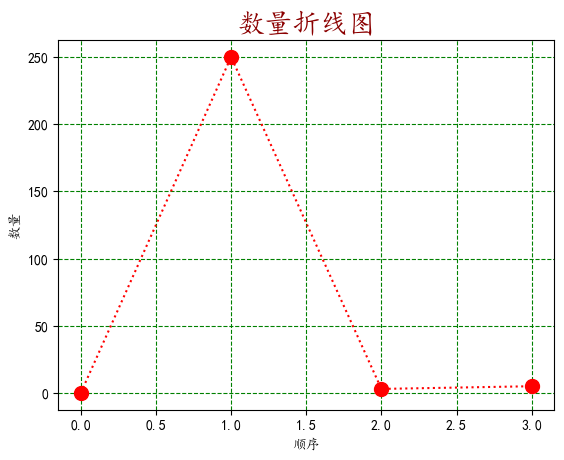
matplotlib.rcParams['font.sans-serif'] = ['KaiTi']

ypoints = np.array([0,250,3,5])

# 设置字体属性
font1 = {'family' : 'sans-serif' , 'color' : 'darkred' , 'size' : 20 }


plt.plot(ypoints , 'o:r' ,ms = 10)
# 设置标签
plt.title("数量折线图" , fontdict = font1)
plt.xlabel("顺序");
plt.ylabel("数量")
plt.grid(color = 'green' , linestyle = '--' , axis ="both")  #axis = 'x' 默认值是both  x轴
plt.show()
绘制多图
x = ...
y = ...
# 2行1列 该子图是第二个
plt.subplot(2,1,2)
plt.plot(x,y)

plt.suptitle("...")   # 大标题
plt.show()

plt.tight_layout() # 可以自适应调整图片的位置
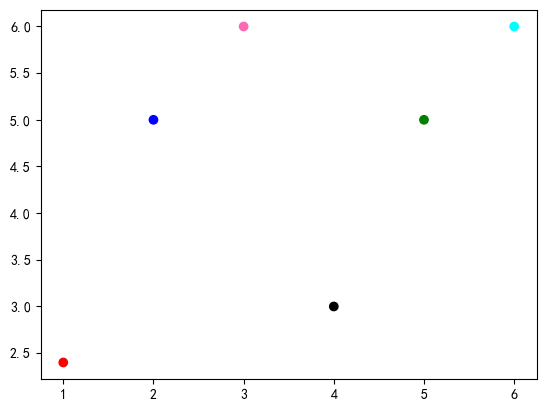
绘制散点图 scatter()
x = np.array([1,2,3,4,5,6])
y = np.array([2.4,5,6,3,5,6])

# 进阶元素数组
colors = np.array(['red','blue','hotpink','black','green','cyan'])

plt.scatter(x,y,c = colors)
plt.show()
进阶用法颜色图
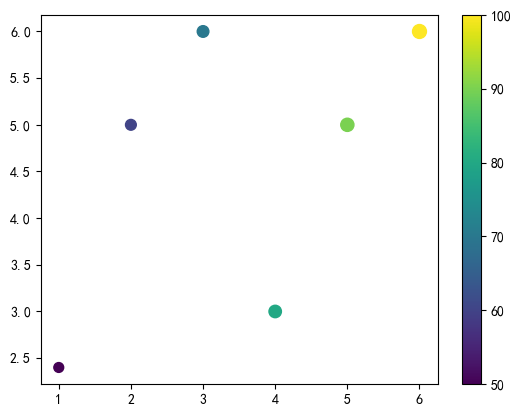
x = np.array([1,2,3,4,5,6])
y = np.array([2.4,5,6,3,5,6])

# 进阶颜色图
colors = np.array([50,60,70,80,90,100])
sizes = np.array([50,60,70,80,90,100])
plt.scatter(x,y,c = colors , cmap = 'viridis' , s = sizes , alpha = 0.5)  # 注意这里要多加一个参数  # 透明度是 alpha
plt.colorbar() # 传入colorbar方法

plt.show()


'''
   这里的cmap = ‘nipy_spectral’是一个颜色map

   获取随机整数
   x = np.random.randint(100,size = (100))
'''
创建柱状图
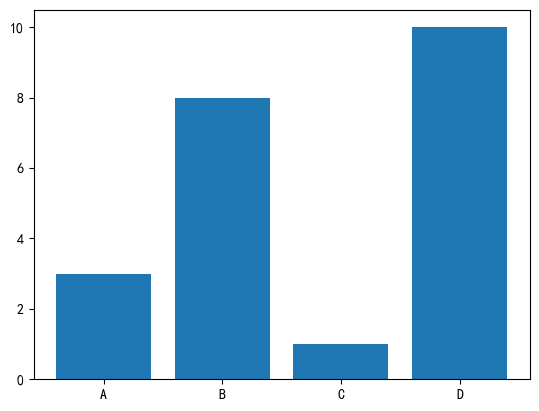
x = np.array(["A","B","C","D"])
y = np.array([3,8,1,10])

plt.bar(x,y)
plt.show()
# 简化版本
x = ["A","B","C","D"]
y = [3,8,1,10]

plt.bar(x,y)
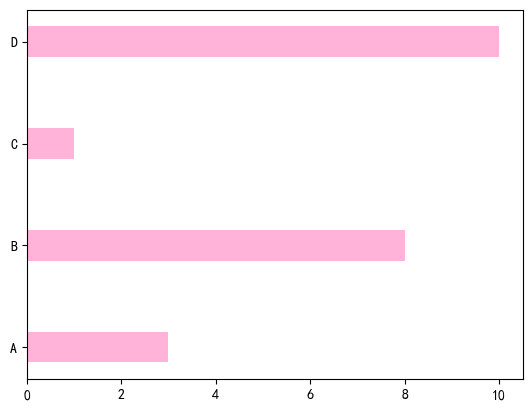
# 水平柱状图   barh()
# 还可以设置宽度和高度 width height
x = ["A","B","C","D"]
y = [3,8,1,10]


plt.barh(x,y,color = "hotpink" , alpha = 0.5 , height = 0.3 )
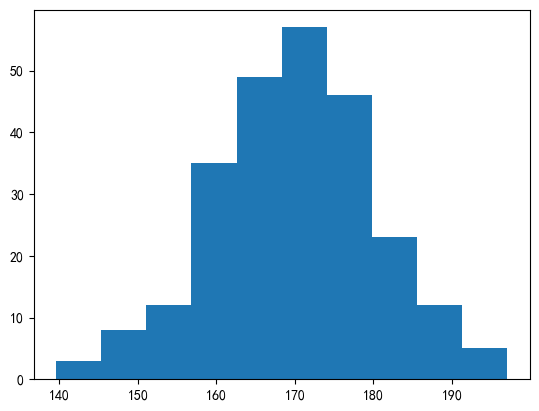
创建直方图
x = np.random.normal(170,10,250)  # 平均值 170 标准差 10 包含 250 个值
plt.hist(x)
plt.show()
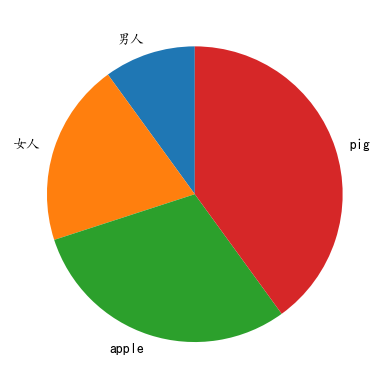
创建饼图
y = np.array([10,20,30,40])
myLabels = np.array(["男人" , "女人" , "apple" , "pig"])
plt.pie(y , labels = myLabels , startangle= 90)   # 起始角度
plt.show()
explode()函数
# explode函数

y = np.array([10,20,30,40])
myLabels = np.array(["男人" , "女人" , "apple" , "pig"])
myexplode = np.array([0 , 0.1 , 0 , 0 ])
plt.pie(y , labels = myLabels , startangle= 90 , explode = myexplode)   # 起始角度
plt.show()
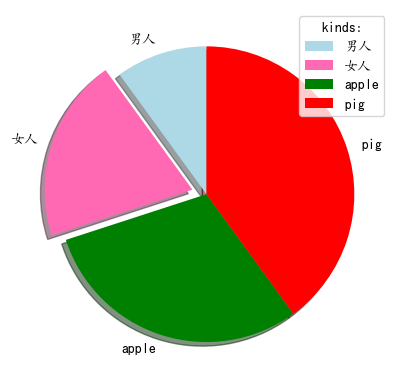
设置阴影 和颜色数组 和图例
# 设置阴影 和颜色数组
# 设置图例
y = np.array([10,20,30,40])
myLabels = np.array(["男人" , "女人" , "apple" , "pig"])
myexplode = np.array([0 , 0.1 , 0 , 0 ])
myColors = np.array(['lightblue' , 'hotpink' , 'green' , 'red'])

plt.pie(y , labels = myLabels , startangle= 90 , explode = myexplode , shadow = True , colors = myColors)   # 起始角度

plt.legend(title = "kinds:")
plt.show()

plt.tight_layout()


 浙公网安备 33010602011771号