
vue 省飞机航线
这里是每个省份的数据包,分json跟js,当当显示地图用json,显示航线用js
链接: https://pan.baidu.com/s/1VuTXGIEi4uro0rM_jNvKDA 提取码: 9c9q
自己把代码拿去允许总比我bb要好
<template>
<div>
<div :id="id" class="o-echarts">
</div>
<div class="home">
<div id="map-chart" style="width: 1000px;height: 1000px"></div>
</div>
</div>
</template>
<script>
import JSON from '../../provinceJson/fujian.json';
import'../../provinceJS/fujian';
export default {
name: "Province",
data() {
return {
chart: null,
fujianMap:{
福州: [119.306239,26.075302],
厦门: [118.11022,24.490474],
莆田: [119.007558,25.431011],
三明: [117.635001,26.265444],
漳州: [117.661801,24.510897],
泉州: [118.589421,24.908853],
南平: [118.178459,26.635627],
龙岩: [117.02978,25.091603],
宁德: [119.527082,26.65924],
},
id: 'echarts_' + new Date().getTime() + Math.floor(Math.random() * 1000),
echartObj: null,
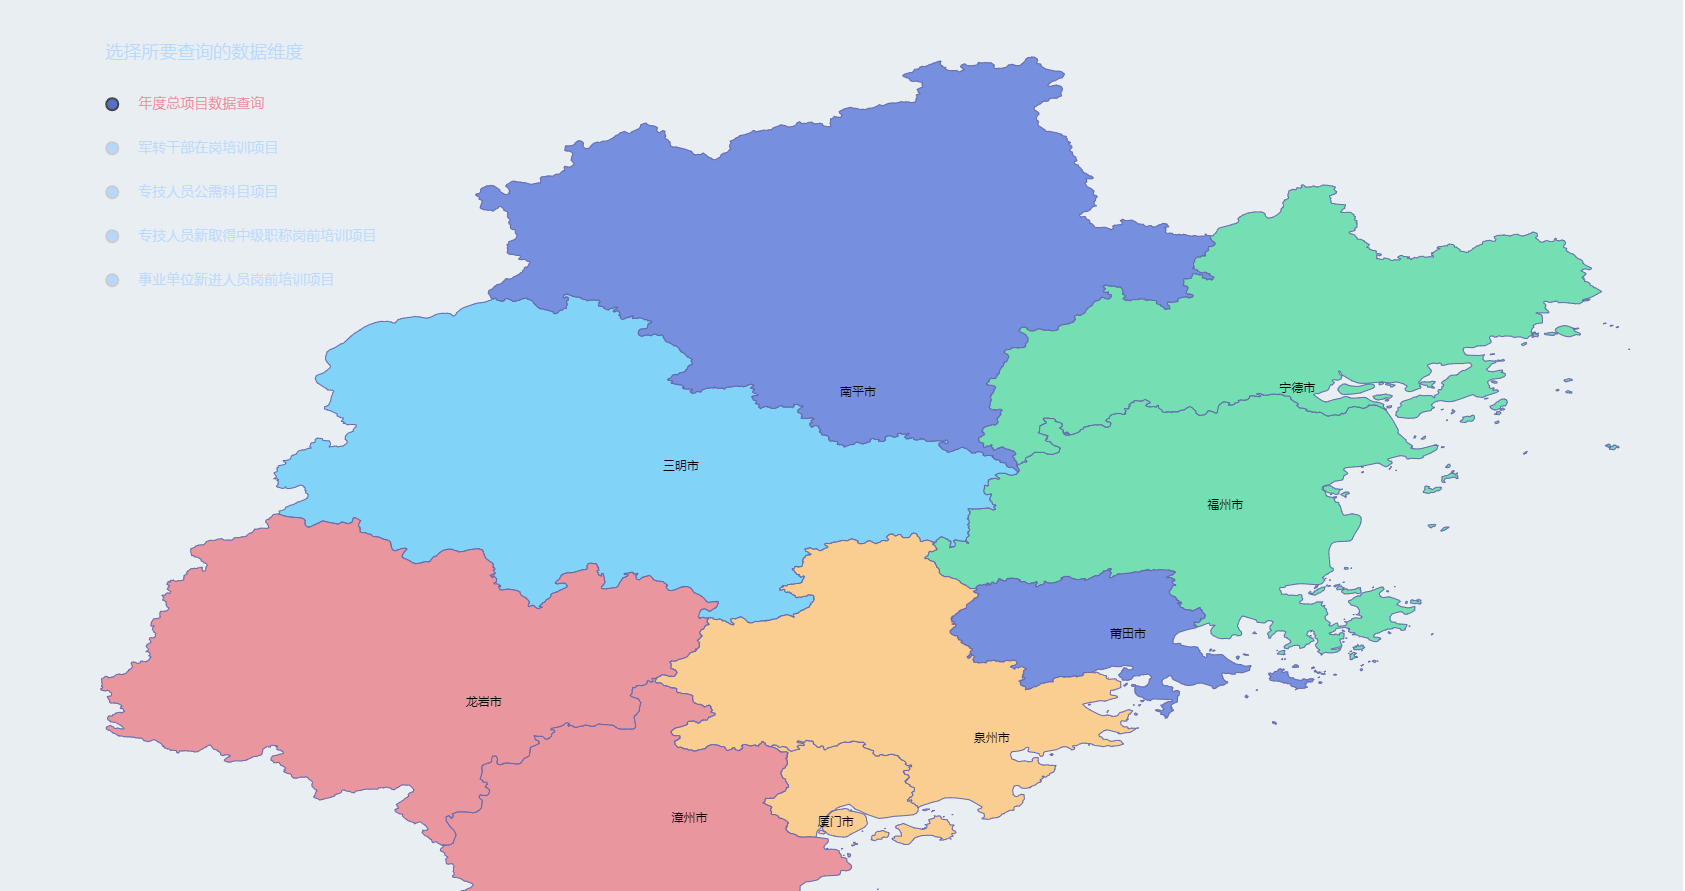
radioList: {
A: '年度总项目数据查询',
B: '军转干部在岗培训项目',
C: '专技人员公需科目项目',
D: '专技人员新取得中级职称岗前培训项目',
E: '事业单位新进人员岗前培训项目'
},
radioActive: 'A',
option: {
title: {
text: '选择所要查询的数据维度',
top: '3%',
left: '5%',
textStyle: {
fontSize: 18,
fontWeight: 300,
color: '#b6d7ff'
}
},
tooltip: {
padding: 0,
backgroundColor: 'transparent',
formatter: params => {
// params.data
return `<table class="map__tooltip o_font20">
<thead>
<tr>
<th>总购买人数</th>
<th>本年度总购买人数</th>
<th>本月度总购买人数</th>
<th>总完成人数</th>
</tr>
</thead>
<tbody>
<tr>
<th>${params.data.obj.a}</th>
<th>${params.data.obj.b}</th>
<th>${params.data.obj.c}</th>
<th>${params.data.obj.d}</th>
</tr>
</tbody>
</table>`;
}
},
legend: {
orient: 'vertical',
top: '9%',
left: '5%',
icon: 'circle',
data: [],
selectedMode: 'single',
selected: {},
itemWidth: 12,
itemHeight: 12,
itemGap: 30,
inactiveColor: '#b6d7ff',
textStyle: {
color: '#ec808d',
fontSize: 14,
fontWeight: 300,
padding: [0, 0, 0, 15]
}
},
visualMap: {
min: 0,
max: 500,
show: false,
splitNumber: 5,
inRange: {
color: ['#FACD91', '#74DFB2', '#81D3F8', '#768FDE', '#e9969f'].reverse()
},
textStyle: {
color: '#fff'
}
},
geo: {
map: '福建',
label: {
normal: {
show: true,
color: '#000'
},
emphasis: {
show: true,
color: '#fff'
}
},
roam: false,
itemStyle: {
normal: {
areaColor: '#8db200',
borderColor: '#6367ad',
borderWidth: 1
},
emphasis: {
areaColor: '#feb6aa' // hover效果
}
},
left: '5%',
right: '5%',
top: '5%',
bottom: '5%'
},
series: [{
name: '年度总项目数据查询',
type: 'map',
geoIndex: 0, // 不可缺少,否则无tooltip 指示效果
data: []
}]
}
};
},
mounted() {
var echarts = require('echarts');
this.echartObj = echarts.init(document.getElementById(this.id));
echarts.registerMap('福建', JSON);
this.echartObj.setOption(this.getOptions(), true);
this.echartObj.on('legendselectchanged', params => {
this.radioActive = Object.keys(this.radioList).filter(item => this.radioList[item] === params.name)[0];
this.echartObj.clear();
this.echartObj.setOption(this.getOptions());
});
window.addEventListener('resize', () => {
if (this.echartObj && this.echartObj.resize) {
this.echartObj.resize();
}
});
this.initChart();
},
methods: {
getOptions() {
this.setOptions('legend', {
data: Object.values(this.radioList),
selected: (list => {
const obj = {};
Object.keys(list).map((item, index) => {
obj[list[item]] = item === this.radioActive;
});
return obj;
})(this.radioList)
});
this.setOptions('series', (() => {
const arr = [];
Object.values(this.radioList)
.map((item, index) => {
arr[this.radioList[this.radioActive] === item ? 'unshift' : 'push']({
name: item,
type: 'map',
geoIndex: 0, // 不可缺少,否则无tooltip 指示效果
data: this.getSeriesData(item)
});
});
return arr;
})());
return this.option;
},
getSeriesData(item) {
return this.radioList[this.radioActive] === item ? JSON.features.map(item => {
return {
name: item.properties.name,
value: Math.ceil(Math.random() * 500),
obj: {
a: Math.ceil(Math.random() * 500),
b: Math.ceil(Math.random() * 500),
c: Math.ceil(Math.random() * 500),
d: Math.ceil(Math.random() * 500)
}
};
}) : [];
},
setOptions(objKey, objVal) {
if (this.option[objKey] && typeof this.option[objKey] === 'object' && !Array.isArray(this.option[objKey])) {
this.option[objKey] = Object.assign(this.option[objKey], objVal);
} else {
this.option[objKey] = objVal;
}
this.$set(this.option, objKey, this.option[objKey]);
},
initChart() {
var echarts = require('echarts');
const BJData = [
[{ name: "福州" }, { name: "厦门", value: 95 }],
[{ name: "福州" }, { name: "莆田", value: 90 }],
[{ name: "福州" }, { name: "南平", value: 80 }],
[{ name: "福州" }, { name: "泉州", value: 70 }],
[{ name: "福州" }, { name: "宁德", value: 60 }],
[{ name: "福州" }, { name: "三明", value: 50 }],
[{ name: "福州" }, { name: "漳州", value: 40 }],
[{ name: "福州" }, { name: "龙岩", value: 30 }]
];
const SHData = [
[{ name: "厦门" }, { name: "福州", value: 95 }],
[{ name: "厦门" }, { name: "莆田", value: 90 }],
[{ name: "厦门" }, { name: "南平", value: 80 }],
[{ name: "厦门" }, { name: "泉州", value: 70 }],
[{ name: "厦门" }, { name: "宁德", value: 60 }],
[{ name: "厦门" }, { name: "三明", value: 50 }],
[{ name: "厦门" }, { name: "漳州", value: 40 }],
[{ name: "厦门" }, { name: "龙岩", value: 30 }]
];
const GZData = [
[{ name: "莆田" }, { name: "厦门", value: 95 }],
[{ name: "莆田" }, { name: "福州", value: 90 }],
[{ name: "莆田" }, { name: "南平", value: 80 }],
[{ name: "莆田" }, { name: "泉州", value: 70 }],
[{ name: "莆田" }, { name: "宁德", value: 60 }],
[{ name: "莆田" }, { name: "三明", value: 50 }],
[{ name: "莆田" }, { name: "漳州", value: 40 }],
[{ name: "莆田" }, { name: "龙岩", value: 30 }]
];
const color = ["#a6c84c", "#ffa022", "#46bee9"];
const planePath =
"path://M1705.06,1318.313v-89.254l-319.9-221.799l0.073-208.063c0.521-84.662-26.629-121.796-63.961-121.491c-37.332-0.305-64.482,36.829-63.961,121.491l0.073,208.063l-319.9,221.799v89.254l330.343-157.288l12.238,241.308l-134.449,92.931l0.531,42.034l175.125-42.917l175.125,42.917l0.531-42.034l-134.449-92.931l12.238-241.308L1705.06,1318.313z";
const series = [];
[
["福州", BJData],
["厦门", SHData],
["莆田", GZData]
].forEach((item, i) => {
series.push(
{
name: item[0] + " Top10",
type: "lines",
zlevel: 1,
effect: {
show: true,
period: 6,
trailLength: 0.7,
color: "#fff",
symbolSize: 3
},
lineStyle: {
normal: {
color: color[i],
width: 0,
curveness: 0.2
}
},
data: this.convertData(item[1])
},
{
name: item[0] + " Top10",
type: "lines",
zlevel: 2,
symbol: ["none", "arrow"],
symbolSize: 10,
effect: {
show: true,
period: 6,
trailLength: 0,
symbol: planePath,
symbolSize: 15
},
lineStyle: {
normal: {
color: color[i],
width: 1,
opacity: 0.6,
curveness: 0.2
}
},
data: this.convertData(item[1])
},
{
name: item[0] + " Top10",
type: "effectScatter",
coordinateSystem: "geo",
zlevel: 2,
rippleEffect: {
brushType: "stroke"
},
label: {
normal: {
show: true,
position: "right",
formatter: "{b}"
}
},
symbolSize: function(val) {
return val[2] / 8;
},
itemStyle: {
normal: {
color: color[i]
}
},
data: item[1].map(dataItem => {
return {
name: dataItem[1].name,
value: this.fujianMap[dataItem[1].name].concat([
dataItem[1].value
])
};
})
}
);
});
const option = {
backgroundColor: "#404a59",
title: {
text: "模拟迁徙",
subtext: "数据纯属虚构",
left: "center",
textStyle: {
color: "#fff"
}
},
tooltip: {
trigger: "item"
},
legend: {
orient: "vertical",
top: "bottom",
left: "right",
data: ["福州 Top10", "厦门 Top10", "莆田 Top10"],
textStyle: {
color: "#fff"
},
selectedMode: "single"
},
geo: {
map: "福建",
label: {
emphasis: {
show: false
}
},
roam: true,
itemStyle: {
normal: {
areaColor: "#323c48",
borderColor: "#404a59"
},
emphasis: {
areaColor: "#2a333d"
}
}
},
series: series
};
this.chart = echarts.init(document.getElementById("map-chart"));
this.chart.setOption(option);
},
convertData(data) {
const res = [];
for (let i = 0; i < data.length; i++) {
const dataItem = data[i];
const fromCoord = this.fujianMap[dataItem[0].name];
const toCoord = this.fujianMap[dataItem[1].name];
if (fromCoord && toCoord) {
res.push({
fromName: dataItem[0].name,
toName: dataItem[1].name,
coords: [fromCoord, toCoord]
});
}
}
return res;
}
}
}
</script>
<style scoped>
.o-echarts {
min-width: 1000px;
min-height: 880px;
}
</style>
运行效果:
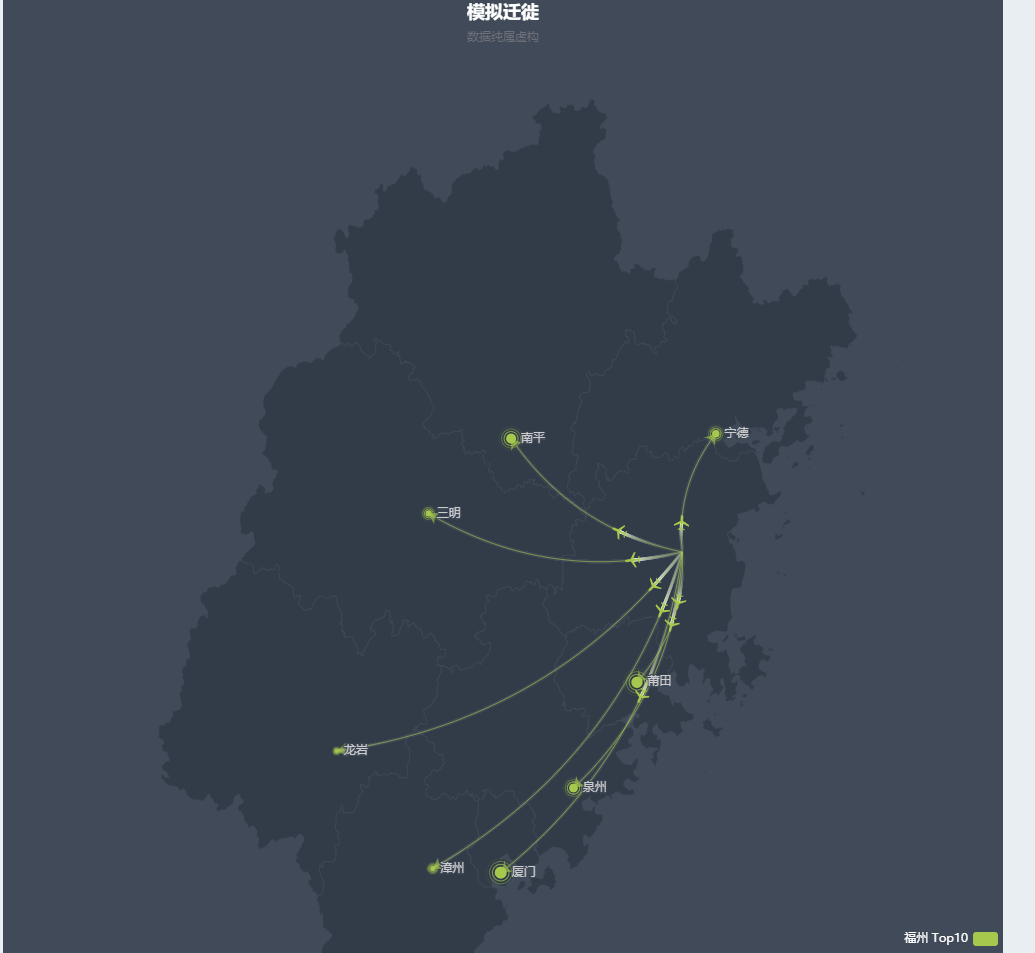
其实呢,这里有个bug:

我在网上找了很多省份的航线图,但是就是没有,所以我就自己通过修改全国的航线图来实现,结果就像上面一样,他能运行,能显示,但是有一个bug
很烦,如果有人知道怎么解决,麻烦告知,谢谢了

 浙公网安备 33010602011771号