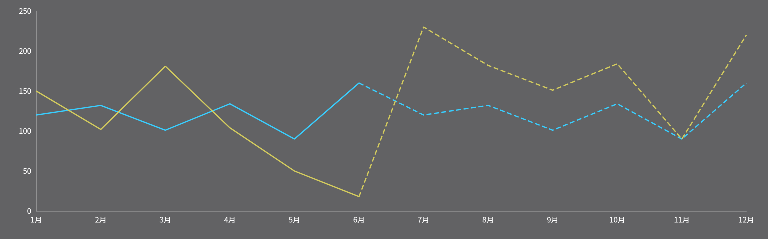
虚实折线图
import React, { Component } from 'react';
import * as echart from 'echarts';
import { hexToRgba, compare } from '@/utils/tools';
import styles from './index.less';

/**
 *  折线图
 */
class ManyLine extends Component {
  constructor(props) {
    super(props);
    this.chartRef = React.createRef();
  }
  chartRef;
  chart;
  selectSeries;

  componentDidUpdate(props, state) {
    if (JSON.stringify(props.dataAll) !== JSON.stringify(this.props.dataAll)) {
      this.init()
    }
  }

  componentDidMount() {
    this.init()
  }
  //  数据 参照
  dataAll = {
    seriesData1: [
      { data: [120, 132, 101, 134, 90, 160], name: '绿码',finalData:[['1月',120],['2月',132],['3月',101],['4月',134],['5月',90],['6月',160]] },
      { data: [150, 102, 181, 104, 50, 18], name: '红码',finalData:[['1月',150],['2月',102],['3月',181],['4月',104],['5月',50],['6月',18]] },
    ],
    seriesData2: [
        { data: [200, 132, 101, 134, 90, 2250], name: '绿码',finalData:[['7月',120],['8月',132],['9月',101],['10月',134],['11月',90],['12月',160]]  },
        { data: [230, 182, 151, 184, 90, 220], name: '红码',finalData:[['7月',230],['8月',182],['9月',151],['10月',184],['11月',90],['12月',220]] },
    ],
    title: '',
    splitNumber: 5,
    islegend: false,
    xAxis: ['1月', '2月', '3月', '4月', '5月', '6月', '7月', '8月', '9月', '10月', '11月', '12月']
  }

  // 默认图标 颜色
  colorList = ['#39CEFF', '#D3CB5E', '#C85B49','#11F99F','#FF6C00','#21BAD6','wheat','pink','plum'];

  init() {
    // 基于准备好的dom,初始化echart实例
    if (this.chart != null && this.chart != "" && this.chart != undefined) {
      this.chart.dispose();//解决echarts dom已经加载的报错
    }
    // 基于准备好的dom,初始化echart实例
    this.chart = echart.init(this.chartRef.current, null, { devicePixelRatio: 2.5 });
    this.chart.clear();
    this.setOptions();
    window.addEventListener("resize", () => {
      this.chart.resize();
    });
    this.chart.on('mousemove',function(params){
        console.log('move',params)
        window.selectSeries = params.seriesName
        console.log('moveGot',window.selectSeries)
    })
    this.chart.on('mouseout',function(params){
        window.selectSeries = '';
    })
  }

  setOptions() {
    const { dataAll = this.dataAll, colorList = this.colorList, color = '#39CEFF' } = this.props;
    console.log('dataAll',dataAll)
    let xLen = [];
    let yLen = [];
    if(!dataAll){
      return false;
    }
    // dataAll.seriesData.map(item => {
    //   yLen.push({ len: String(Math.max(...item.data)).length });
    // })
    dataAll.xAxis.map(item => {
      xLen.push({ len: item.length });
    })
    let len = 24;
    console.log('len: ', len);
    let len1 = xLen.sort(compare('len', '1'))[0]?.len;
    console.log('len1: ', len1);
    dataAll.seriesData2?.map((item,index)=>{
        item.finalData.unshift(dataAll.seriesData1[index].finalData[dataAll.seriesData1[index].finalData.length - 1])
    })

    // 绘制图表
    let series = [], legendData = [];
    //实线部分
    dataAll.seriesData1?.forEach((item, index) => {
      series.push({
        name: item.name,
        type: 'line',
        // smooth: true,
        data: item.finalData,
        symbol: 'circle',
        // symbol: `image://${require('../../../../../public/imgs/line_circle.png')}`,
        symbolSize: [10,10],
        showSymbol: false,

        lineStyle: {
          color: colorList[index],
          width: 2
        },
        // tooltip:{
        //     show:false
        // },
      });
      let count = 0;
      item.data.forEach(element => {
        count += element;
      });
      legendData.push({ name: item.name, count: count })
    });

    //虚线部分
    dataAll.seriesData2?.forEach((item, index) => {
        series.push({
          name: item.name,
          type: 'line',
          // smooth: true,
          data: item.finalData,
          lineStyle: {
            type: 'dashed',
            color: colorList[index],
            width: 2
          },
          symbol: 'circle',
        //   symbol: `image://${require('../../../../../public/imgs/line_circle.png')}`,
          symbolSize: [10, 10],
          showSymbol: false,
        //   tooltip:{
        //     show:false
        //   },
        });
        let count = 0;
        item.data.forEach(element => {
          count += element;
        });
        legendData.push({ name: item.name, count: count })
      })

    const option = {
      color: colorList,
      tooltip: {
        trigger: 'axis',
        axisPointer: {
          type: 'line',
          lineStyle: {
            color: hexToRgba(color, 0.5)
          },
        },


        // padding: 0,
        // backgroundColor: "transparent",
        // formatter: function(params){
        // let str = `<div style = "

        // width:100%;height:100%; ">
        // ${params.name}</div>`; // 设置显示内容
        // return str;
        // }
        backgroundColor: "transparent",
        borderColor:"transparent",
        padding: 0,
        formatter:function(params){
        //    console.log('params',params)
           console.log('window.selectSeries',window.selectSeries)
           let res = '';
           let len = dataAll.seriesData1.length;

           for(let i = 0;i<params.length;i++){
              let series = params[i];
              let index = series.seriesIndex;
              let finalIndex = null;
              if(index < len){
                  finalIndex = index
              }else{
                  finalIndex = index - len;
              }
              if(series.seriesName == window.selectSeries){
                  res = `<div style = "
                   background-color: ${colorList[finalIndex]};
                   min-width:38px;height:23px;
                   font-size: 14px;
                   font-family: PangMenZhengDao;
                   font-weight: 400;
                   color: #06152B;
                   display:flex;
                   align-items:center;
                   justify-content: center;
                    ">
                   ${series.seriesName}</div>`
                  break;
              }
           }
           return res
        }
      },
      title: {
        show: dataAll.title ? true : false,
        text: dataAll.title,
        textStyle: {
          color: '#666666',
          fontWeight: 'normal',
          fontSize: 14,
        }
      },
      grid: {
        left: len * 1,
        right: '5%',
        top: '5%',
        bottom: '10%',
        containLabel: true,
      },
      // 图列
      legend: {
        show: dataAll.islegend,
        icon: 'rect',
        itemWidth: 10,
        itemHeight: 10,
        textStyle: {
          fontFamily: 'SourceHanSansCN',
          color: '#fff'
        },
        formatter: (name) => {
          let count = 0;
          legendData.forEach(element => {
            if (element.name == name) {
              count = element.count;
            }
          });
          return name + " " + count + '人';
        },
        data: legendData
      },
      xAxis: {
        type: 'category',
        boundaryGap: false,
        data: dataAll.xAxis,
        axisLine: { show: true, lineStyle: { color: hexToRgba("#ffffff", 0.3) } },
        axisTick: { show: false },
        axisLabel: { color: '#fff', fontSize: 12, fontFamily: 'SourceHanSansCN',interval:0},
        showMinLabel: true,
        showMaxLabel: true,
      },
      yAxis: {
        type: 'value',
        axisLabel: { color: '#fff', fontSize: 12, fontFamily: 'SourceHanSansCN' },
        axisLine: { show: true, lineStyle: { color: hexToRgba("#ffffff", 0.3) } },
        axisTick: { show: false },
        minInterval: 1,
        splitNumber: dataAll.splitNumber,
        splitLine: {
          show: false
        }
      },
      series: series
    };

    // 绘制图表
    this.chart.setOption(option);
    window.addEventListener('resize', () => {
      this.chart.resize();
    })
  }

  render() {
    const { width,title} = this.props;
    let height = this.props.height || '100%';
    return (<div style={{ width: width ? width : `100%`, height: height, position: 'relative' }} className={`${styles.container}`}>
      <div ref={this.chartRef} style={{ width: width ? width : `100%`, height: (title && typeof title === 'string') ? `calc(${height} - 20px)` : height }}></div>
    </div>
    )
  }
}

export default ManyLine;
import React, { Component } from 'react';
import * as echart from 'echarts';
import { hexToRgba, compare } from '@/utils/tools';
import styles from './index.less';
/**
* 折线图
*/
class ManyLine extends Component {
constructor(props) {
super(props);
this.chartRef = React.createRef();
}
chartRef;
chart;
selectSeries;
componentDidUpdate(props, state) {
if (JSON.stringify(props.dataAll) !== JSON.stringify(this.props.dataAll)) {
this.init()
}
}
componentDidMount() {
this.init()
}
// 数据 参照
dataAll = {
seriesData1: [
{ data: [120, 132, 101, 134, 90, 160], name: '绿码',finalData:[['1月',120],['2月',132],['3月',101],['4月',134],['5月',90],['6月',160]] },
{ data: [150, 102, 181, 104, 50, 18], name: '红码',finalData:[['1月',150],['2月',102],['3月',181],['4月',104],['5月',50],['6月',18]] },
],
seriesData2: [
{ data: [200, 132, 101, 134, 90, 2250], name: '绿码',finalData:[['7月',120],['8月',132],['9月',101],['10月',134],['11月',90],['12月',160]] },
{ data: [230, 182, 151, 184, 90, 220], name: '红码',finalData:[['7月',230],['8月',182],['9月',151],['10月',184],['11月',90],['12月',220]] },
],
title: '',
splitNumber: 5,
islegend: false,
xAxis: ['1月', '2月', '3月', '4月', '5月', '6月', '7月', '8月', '9月', '10月', '11月', '12月']
}
// 默认图标 颜色
colorList = ['#39CEFF', '#D3CB5E', '#C85B49','#11F99F','#FF6C00','#21BAD6','wheat','pink','plum'];
init() {
// 基于准备好的dom,初始化echart实例
if (this.chart != null && this.chart != "" && this.chart != undefined) {
this.chart.dispose();//解决echarts dom已经加载的报错
}
// 基于准备好的dom,初始化echart实例
this.chart = echart.init(this.chartRef.current, null, { devicePixelRatio: 2.5 });
this.chart.clear();
this.setOptions();
window.addEventListener("resize", () => {
this.chart.resize();
});
this.chart.on('mousemove',function(params){
console.log('move',params)
window.selectSeries = params.seriesName
console.log('moveGot',window.selectSeries)
})
this.chart.on('mouseout',function(params){
window.selectSeries = '';
})
}
setOptions() {
const { dataAll = this.dataAll, colorList = this.colorList, color = '#39CEFF' } = this.props;
console.log('dataAll',dataAll)
let xLen = [];
let yLen = [];
if(!dataAll){
return false;
}
// dataAll.seriesData.map(item => {
// yLen.push({ len: String(Math.max(...item.data)).length });
// })
dataAll.xAxis.map(item => {
xLen.push({ len: item.length });
})
let len = 24;
console.log('len: ', len);
let len1 = xLen.sort(compare('len', '1'))[0]?.len;
console.log('len1: ', len1);
dataAll.seriesData2?.map((item,index)=>{
item.finalData.unshift(dataAll.seriesData1[index].finalData[dataAll.seriesData1[index].finalData.length - 1])
})
// 绘制图表
let series = [], legendData = [];
//实线部分
dataAll.seriesData1?.forEach((item, index) => {
series.push({
name: item.name,
type: 'line',
// smooth: true,
data: item.finalData,
symbol: 'circle',
// symbol: `image://${require('../../../../../public/imgs/line_circle.png')}`,
symbolSize: [10,10],
showSymbol: false,
lineStyle: {
color: colorList[index],
width: 2
},
// tooltip:{
// show:false
// },
});
let count = 0;
item.data.forEach(element => {
count += element;
});
legendData.push({ name: item.name, count: count })
});
//虚线部分
dataAll.seriesData2?.forEach((item, index) => {
series.push({
name: item.name,
type: 'line',
// smooth: true,
data: item.finalData,
lineStyle: {
type: 'dashed',
color: colorList[index],
width: 2
},
symbol: 'circle',
// symbol: `image://${require('../../../../../public/imgs/line_circle.png')}`,
symbolSize: [10, 10],
showSymbol: false,
// tooltip:{
// show:false
// },
});
let count = 0;
item.data.forEach(element => {
count += element;
});
legendData.push({ name: item.name, count: count })
})
const option = {
color: colorList,
tooltip: {
trigger: 'axis',
axisPointer: {
type: 'line',
lineStyle: {
color: hexToRgba(color, 0.5)
},
},
// padding: 0,
// backgroundColor: "transparent",
// formatter: function(params){
// let str = `<div style = "
// width:100%;height:100%; ">
// ${params.name}</div>`; // 设置显示内容
// return str;
// }
backgroundColor: "transparent",
borderColor:"transparent",
padding: 0,
formatter:function(params){
// console.log('params',params)
console.log('window.selectSeries',window.selectSeries)
let res = '';
let len = dataAll.seriesData1.length;
for(let i = 0;i<params.length;i++){
let series = params[i];
let index = series.seriesIndex;
let finalIndex = null;
if(index < len){
finalIndex = index
}else{
finalIndex = index - len;
}
if(series.seriesName == window.selectSeries){
res = `<div style = "
background-color: ${colorList[finalIndex]};
min-width:38px;height:23px;
font-size: 14px;
font-family: PangMenZhengDao;
font-weight: 400;
color: #06152B;
display:flex;
align-items:center;
justify-content: center;
">
${series.seriesName}</div>`
break;
}
}
return res
}
},
title: {
show: dataAll.title ? true : false,
text: dataAll.title,
textStyle: {
color: '#666666',
fontWeight: 'normal',
fontSize: 14,
}
},
grid: {
left: len * 1,
right: '5%',
top: '5%',
bottom: '10%',
containLabel: true,
},
// 图列
legend: {
show: dataAll.islegend,
icon: 'rect',
itemWidth: 10,
itemHeight: 10,
textStyle: {
fontFamily: 'SourceHanSansCN',
color: '#fff'
},
formatter: (name) => {
let count = 0;
legendData.forEach(element => {
if (element.name == name) {
count = element.count;
}
});
return name + " " + count + '人';
},
data: legendData
},
xAxis: {
type: 'category',
boundaryGap: false,
data: dataAll.xAxis,
axisLine: { show: true, lineStyle: { color: hexToRgba("#ffffff", 0.3) } },
axisTick: { show: false },
axisLabel: { color: '#fff', fontSize: 12, fontFamily: 'SourceHanSansCN',interval:0},
showMinLabel: true,
showMaxLabel: true,
},
yAxis: {
type: 'value',
axisLabel: { color: '#fff', fontSize: 12, fontFamily: 'SourceHanSansCN' },
axisLine: { show: true, lineStyle: { color: hexToRgba("#ffffff", 0.3) } },
axisTick: { show: false },
minInterval: 1,
splitNumber: dataAll.splitNumber,
splitLine: {
show: false
}
},
series: series
};
// 绘制图表
this.chart.setOption(option);
window.addEventListener('resize', () => {
this.chart.resize();
})
}
render() {
const { width,title} = this.props;
let height = this.props.height || '100%';
return (<div style={{ width: width ? width : `100%`, height: height, position: 'relative' }} className={`${styles.container}`}>
<div ref={this.chartRef} style={{ width: width ? width : `100%`, height: (title && typeof title === 'string') ? `calc(${height} - 20px)` : height }}></div>
</div>
)
}
}
export default ManyLine;
