matplotlib之subploot
matplotlib的subplot笔记.
1.subplot第一个参数为行数,第二个参数为列数。类似matlab中的用法。
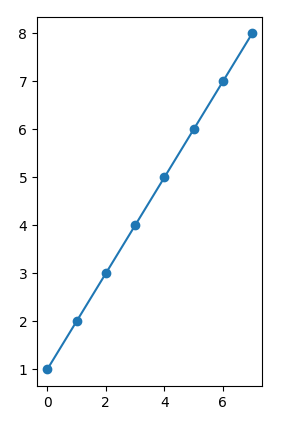
%matplotlib notebook

import matplotlib.pyplot as plt
import numpy as np

plt.figure()
# subplot with 1 row, 2 columns, and current axis is 1st subplot axes
plt.subplot(1, 2, 1)

linear_data = np.array([1,2,3,4,5,6,7,8])

plt.plot(linear_data, '-o')
画图:
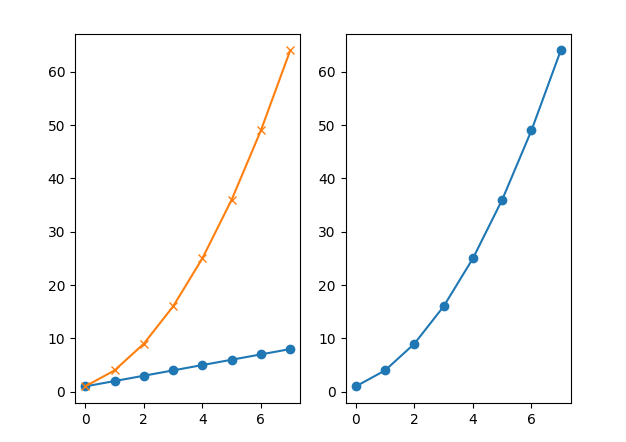
2.加上下边这段代码之后.
exponential_data = linear_data**2

# subplot with 1 row, 2 columns, and current axis is 2nd subplot axes
plt.subplot(1, 2, 2)
plt.plot(exponential_data, '-o')

# plot exponential data on 1st subplot axes
plt.subplot(1, 2, 1)
plt.plot(exponential_data, '-x')
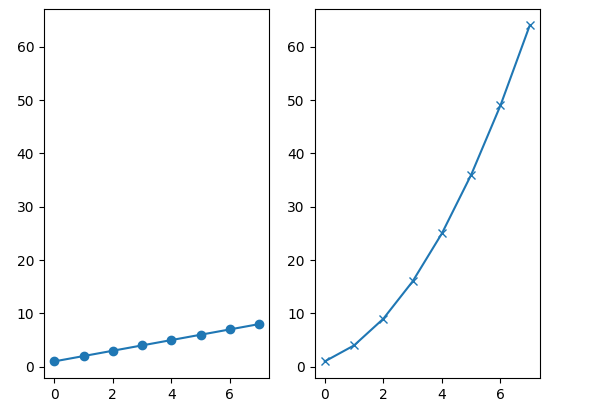
3.让两个subplot的y坐标一致.
plt.figure()
ax1 = plt.subplot(1, 2, 1)
plt.plot(linear_data, '-o')
# pass sharey=ax1 to ensure the two subplots share the same y axis
ax2 = plt.subplot(1, 2, 2, sharey=ax1)
plt.plot(exponential_data, '-x')
4.其中plt.subplot(1,2,1)的表示方法和plt.subplot(121)含义一致。
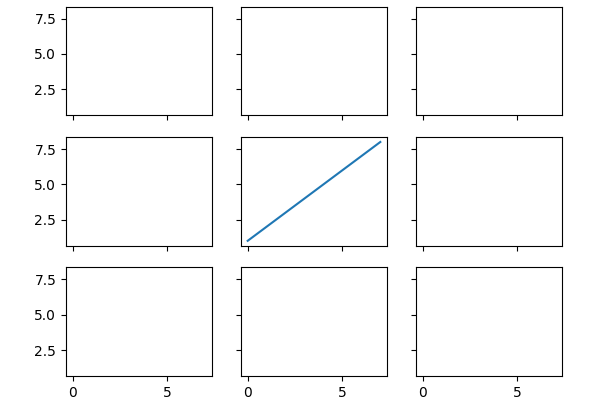
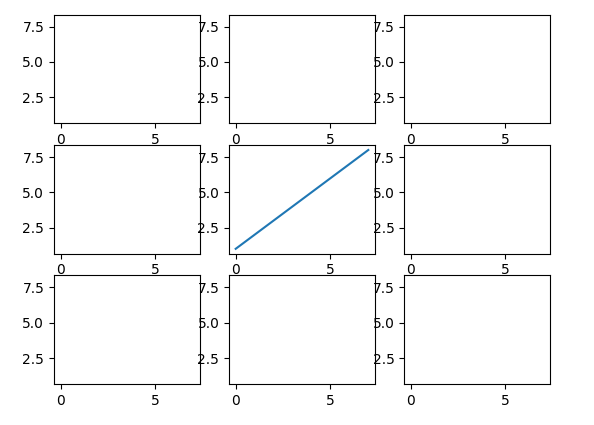
5.构造多个subplot
# create a 3x3 grid of subplots
fig, ((ax1,ax2,ax3), (ax4,ax5,ax6), (ax7,ax8,ax9)) = plt.subplots(3, 3, sharex=True, sharey=True)
# plot the linear_data on the 5th subplot axes
ax5.plot(linear_data, '-')
6.标记位置
# set inside tick labels to visible
for ax in plt.gcf().get_axes():
    for label in ax.get_xticklabels() + ax.get_yticklabels():
        label.set_visible(True)
# necessary on some systems to update the plot
plt.gcf().canvas.draw()
The Safest Way to Get what you Want is to Try and Deserve What you Want.

 浙公网安备 33010602011771号