asymptote
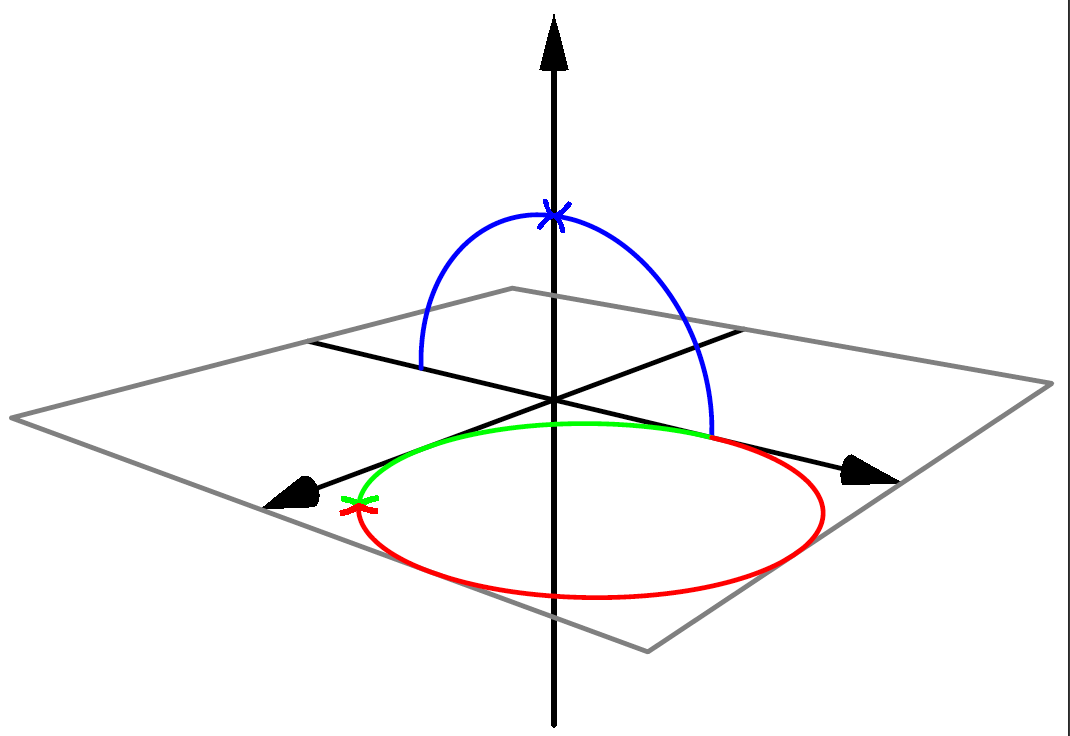
settings.outformat="pdf";
settings.render=0;

import three;
size(4cm);
draw(-2X--2X,arrow=Arrow3(emissive(black)));
draw(-2Y--2Y, arrow=Arrow3(emissive(black)));
draw(-2Z--2Z, arrow=Arrow3(emissive(black)));
draw(path3(box((-2,-2),(2,2))), gray);
draw(arc(c=O, Y, Z), blue, arrow = Arrow3(TeXHead2,emissive(blue)));
draw(arc(c=O, -Y, Z), blue, arrow = Arrow3(TeXHead2,emissive(blue)));
draw(arc(c=(1,1,0), Y, 2X, normal=Z), green, arrow =Arrow3(TeXHead2(normal=Z), emissive(green)));
draw(arc(c=(1,1,0), Y, 2X, normal=-Z), red, arrow =Arrow3(TeXHead2(normal=Z), emissive(red)));

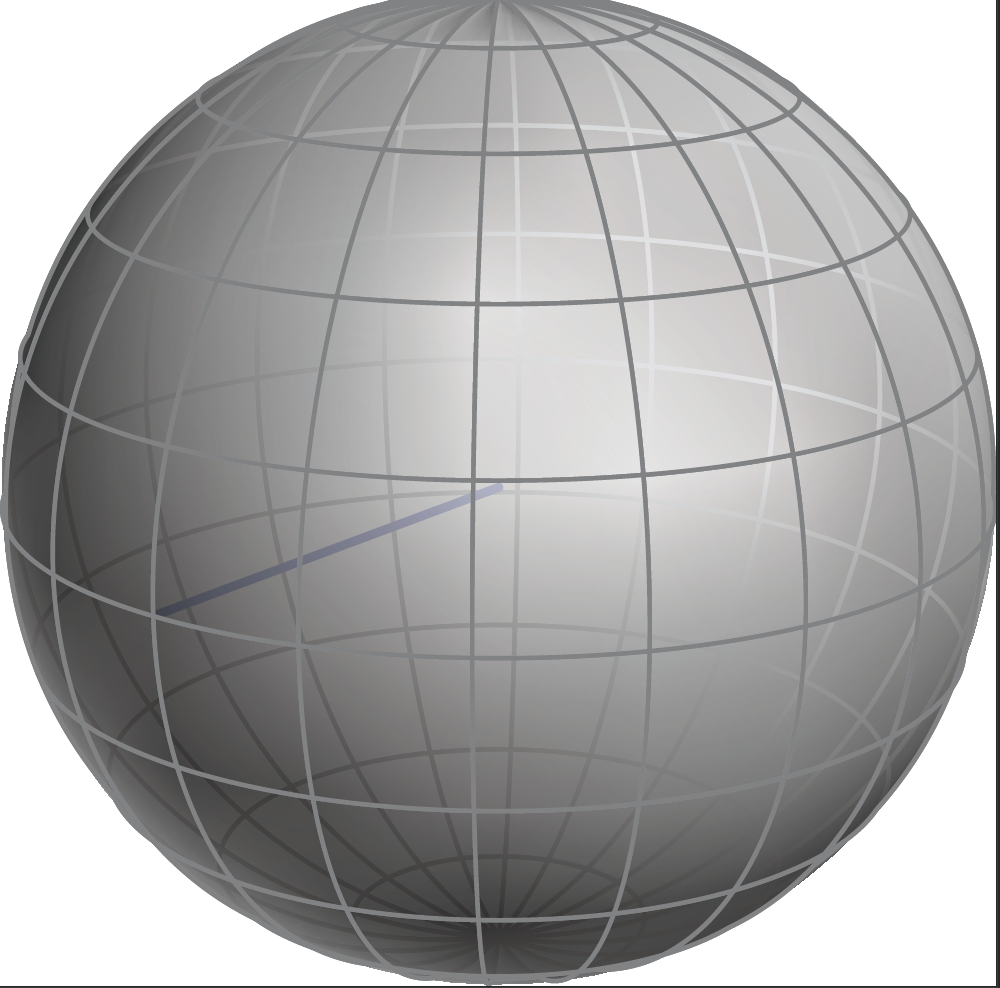
settings.outformat="pdf";
settings.prc=false;
settings.render=0;

import graph3;
size(4cm,0);

path3 myarc = rotate(18,Z) * Arc(c=O,normal=X, v1=-Z, v2=Z, n=10);
surface backHemisphere =surface(myarc, angle1=0,angle2=180, c=O, axis=Z, n=10);
surface frontHemisphere = surface(myarc, angle1=180,angle2=360, c=O, axis=Z, n=10);
draw(backHemisphere, surfacepen=material(white+opacity(0.8),ambientpen=white), meshpen=gray(0.4));
draw(O--X, blue+linewidth(1pt));
draw(frontHemisphere, surfacepen=material(white+opacity(0.8),ambientpen=white), meshpen=gray(0.4));

https://math.uchicago.edu/~cstaats/Charles_Staats_III/Notes_and_papers_files/asymptote_tutorial.pdf
https://github.com/vectorgraphics/asymptote


