期末大作业
2018-12-20 20:54 默默的卖萌 阅读(310) 评论(0) 收藏 举报一、boston房价预测
1. 读取数据集
from sklearn.datasets import load_boston
boston = load_boston()
x = boston.data
y = boston.target
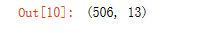
x.shape
2. 训练集与测试集划分
from sklearn.cross_validation import train_test_split
x_train, x_test, y_train, y_test = train_test_split(boston.data,boston.target,test_size=0.3)
x_train.shape
y_train.shape
import pandas as pd
import numpy as np
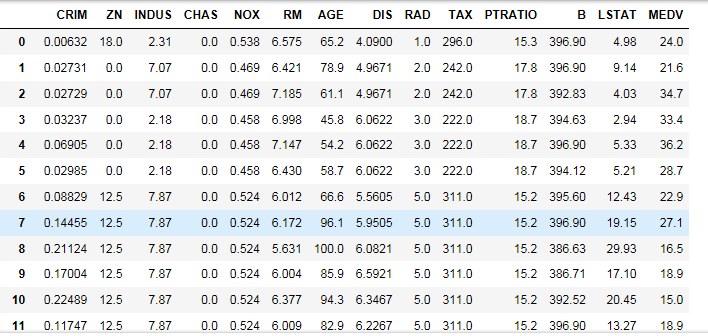
df = pd.DataFrame(data = np.c_[x,y],columns = np.append(boston.feature_names,['MEDV']))
df
3. 线性回归模型:建立13个变量与房价之间的预测模型,并检测模型好坏。
from sklearn.linear_model import LinearRegression
lineR = LinearRegression()
lineR.fit(x_train,y_train)
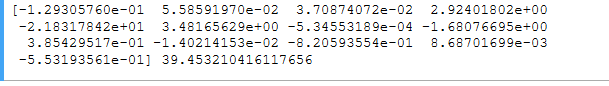
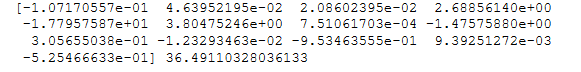
w = lineR.coef_ #斜率
b = lineR.intercept_ #截距
from sklearn.metrics import regression
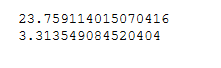
print(regression.mean_squared_error(y_train,train_y_pred)) #均方误差
print(regression.mean_absolute_error(y_test,test_y_pred)) #平均绝对误差
train_y_pred = lineR.predict(x_train) #预测模型
test_y_pred = lineR.predict(x_test)
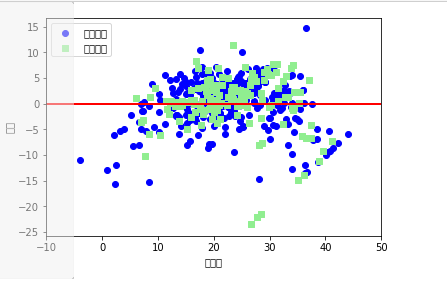
plt.scatter(train_y_pred,train_y_pred-y_train,c="blue",marker="o",label="训练数据")
plt.scatter(test_y_pred,test_y_pred-y_test,c="lightgreen",marker="s",label="测试数据")
plt.legend(loc="upper left")
plt.hlines(y=0,xmin=-10,xmax=50,lw=2,color="red")
plt.xlim([-10,50])
plt.xlabel("预测值")
plt.ylabel("残差")
plt.show()
4. 多项式回归模型:建立13个变量与房价之间的预测模型,并检测模型好坏。
from sklearn.preprocessing import PolynomialFeatures
poly = PolynomialFeatures(degree=2)
x_poly_train = poly.fit_transform(x_train)
x_poly_test = poly.transform(x_test)
lrp = LinearRegression()
lrp.fit(x_poly_train,y_train)
y_poly_pred = lrp.predict(x_poly_test)
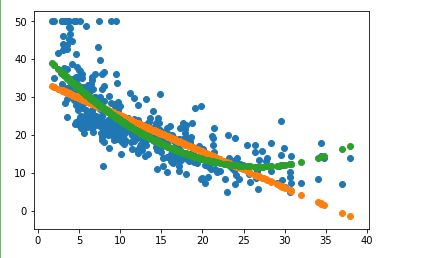
plt.scatter(x_poly_train,y_poly_pred)
plt.scatter(x_poly_test,y_poly_pred)
plt.show()
print(regression.mean_squared_error(y_test,y_poly_pred)) #均方误差
print(regression.mean_absolute_error(y_test,y_poly_pred)) #平均绝对误差
5. 比较线性模型与非线性模型的性能,并说明原因。
线性模型就是每个变量的指数都是1,而非线性模型就是至少有一个变量的指数不是1。
原因是式子中某一个自变量前的系数,如果这个系数只影响一个自变量,那么此模型为线性模型
二、中文文本分类
按学号未位下载相应数据集。
147:财经、彩票、房产、股票、
258:家居、教育、科技、社会、时尚、
0369:时政、体育、星座、游戏、娱乐
分别建立中文文本分类模型,实现对文本的分类。基本步骤如下:
1.各种获取文件,写文件
import sys
import os
import jieba
import numpy as np
path = 'E:\\PyCharm 数据 0369'
def readfile(path):
fp = open(path,"rb")
content = fp.read()
fp.close()
return content

2.除去噪声,如:格式转换,去掉符号,整体规范化
def remove_punctuation(line):
try:
line = re.sub("[!?。。"#$%&'()+,-/:;<=>@[\]^_`{|}~⦅⦆「」、、〃《》「」『』【】〔〕〖〗〘〙〚〛〜〝〞〟–—‘’‛“”„‟…‧﹏.!\"#$\'()+,-./:;<=>?@[\\]^_`{|}~]+".decode("utf-8"), "",line.decode("utf-8"))
except Exception as e:
print (error)
return line
3.遍历每个个文件夹下的每个文本文件。
tokenList = []
targetList = []
# 用os.walk获取需要的变量,并拼接文件路径再打开每一个文件
for root,dirs,files in os.walk(path):
for f in files:
filePath = os.path.join(root,f)
with open(filePath, encoding='utf-8') as f:
content = f.read()
# 获取类别标签,并处理
target = filePath.split('\\')[-2]
targetList.append(target)
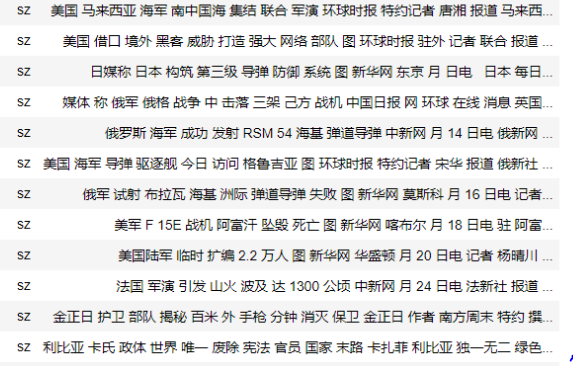
tokenList.append(processing(content))
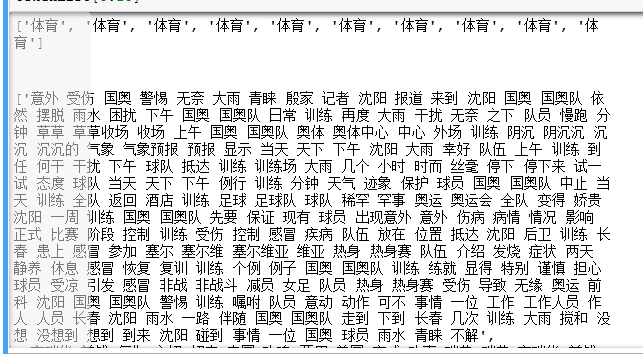
4.使用jieba分词将中文文本切割。
def cutline(line):
line=str(line) #防止只有数字的识别为float
words = jieba.cut(line, cut_all=False)
re=" ".join(words)
return re
5.去掉停用词。
def get_stopwords(path): #获取停用词
f= open(path)
stopwords=[]
for line in f:
stopwords.append(line.strip())
return stopwords
stopwords=get_stopwords("E/stopsCN.txt.txt")
final=[]
for seg in seg_list:
seg=seg.encode("utf8")
if seg not in stopwords:
final.append(seg)
6.对处理之后的文本开始用TF-IDF算法进行单词权值的计算
from sklearn.feature_extraction.text import TfidfVectorizer
from sklearn.model_selection import train_test_split
x_train,x_test,y_train,y_test = train_test_split(weightlist,wordlist,test_size=0.2,stratify=wordlist)
vector = TfidfVectorizer(stop_words=stopwords)
vector.fit(d["x_train"])
weightlist=vector.transform(d["x_test"]).toarray()
wordlist = vector.get_feature_names()
7.贝叶斯预测种类
from sklearn import metrics
from sklearn.naive_bayes import MultinomialNB
from sklearn.model_selection import cross_val_score
from sklearn.metrics import classification_report
clf = MultinomialNB()
clf.fit(x, y)
y_pred = clf.predict(x_test)
scores=cross_val_score(clf,x_test,y_test,cv=5)
print(scores.mean())
print(classification_report(y_pred,y_test))
8.模型评价
#评价标准
print "Accuracy : %.2f" % metrics.accuracy_score(label, pre_reduce)
print "recall : %.2f" % metrics.recall_score(label, pre_reduce)
print "F1 : %.2f" % metrics.f1_score(label, pre_reduce)
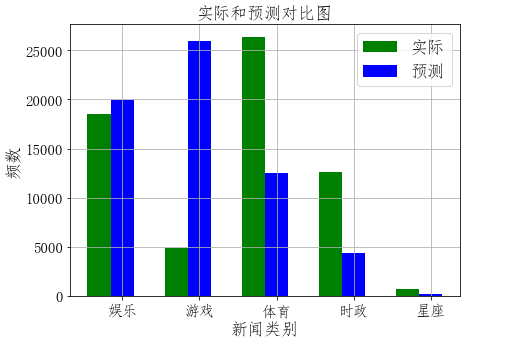
9.新文本类别预测
import collections
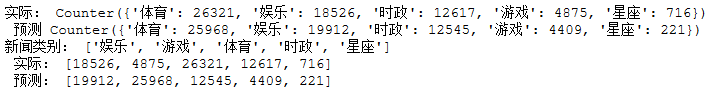
test = collections.Counter(y_test)
pred = collections.Counter(y_pred)
print(test,pred)
# 建立标签列表,实际结果列表,预测结果列表,
plt.figure(figsize=(7,5))
total_width, n = 0.6, 2
width = total_width / n
plt.bar(x, testList, width=width,label='实际',fc = 'g')
for i in range(len(x)):
    x[i] = x[i] + width
plt.bar(x, predictList,width=width,label='预测',tick_label = nameList,fc='b')
plt.grid()
plt.title('实际和预测对比图',fontsize=17)
plt.xlabel('新闻类别',fontsize=17)
plt.ylabel('频数',fontsize=17)
plt.legend(fontsize =17)
plt.tick_params(labelsize=15)
plt.show()

 浙公网安备 33010602011771号