重复测量 - MIXED混合模型
在重复测量GLM中说到,随机效应那是被处理成了固定效应,而不是真正的随机效应。
1. GLM处理重复测量时的缺点
The assumption of compound symmetry required by the ‘univariate’ approach just discussed means that the correlation between a measurement at Time i and any other measurement within the same patient, say at Time j, is the same for all i and j.
假设复合对称,就是同一个patient,任意两个测量点之间的相关关系是相同的。这个假设很苛刻,尤其是有多个测量时间点时。
2. Mixed Model
上述问题,Mixed模型中可通过 TYPE = ,根据需求指定。
如果TYPE = UN: 两两比较,C42加上4个方差。因为这是假设任意两个协方差都不一致。
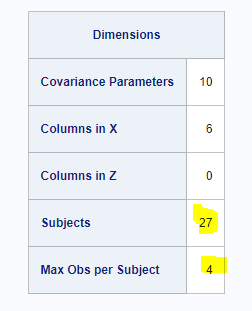
The R matrix is, therefore, block diagonal with 27 blocks, each block consisting of identical 4 x 4 unstructured matrices. The 10 parameters of these unstructured blocks make up the covariance parameters estimated by maximum likelihood
如果TYPE = CS: 就是2个参数。协方差全都相同(只有一个),只有一个方差,一个协方差。

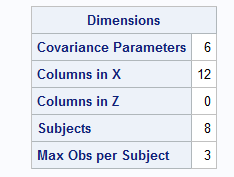
第一块是第一个人有四条观测,第二块是第二个人有两条观测,第三块是第三个人有三个观测。
data arthr;
input vacgrp $ pat mo1 mo2 mo3;
datalines;
ACT 101 6 3 0
ACT 103 7 3 1
ACT 104 4 1 2
ACT 107 8 4 3
PBO 102 6 5 5
PBO 105 9 4 6
PBO 106 5 3 4
PBO 108 6 2 3
;
data discom; set arthr;
keep vacgrp pat visit score;
score = mo1; visit = 1; output;
score = mo2; visit = 2; output;
score = mo3; visit = 3; output;
run;
proc mixed data = discom;
class vacgrp pat visit;
*包含两个固定效应和一个交互效应;
model score = vacgrp visit vacgrp*visit;
*表明visits represent repeated measures within pat(vacgrp).;
repeated visit / subject=pat(vacgrp) type=un r rcorr;
*diff相当于两样本t检验,
slice相当于分组检验,by visit
如果都不加,相当于单样本t检验,均值不等于0得检验
;
lsmeans vacgrp visit vacgrp*visit / diff slice = visit;
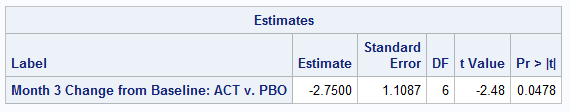
estimate 'Month 3 Change from Baseline: ACT v. PBO'
vacgrp * visit -1 0 1 1 0 -1;
run;
repeated visit / subject=pat(vacgrp)
意思是visit代表pat() 中重复测量。visits represent repeated measures within pat(vacgrp)
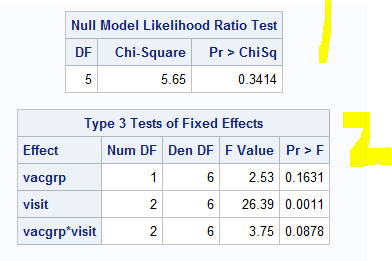
1.是说当使用TYPE = 时,是否比ANOVA残差独立提供更好的拟合。provides a better fit compared with the ANOVA independent errors case (i.e., zero correlation).
2. 是具体的分析
G矩阵:Covariance Parameters: 就是Max Obs per Subject中两两比较,再加上3个Variance。
X:固定效应的变量数目,2+3+2*3+1,ACT PB0是2,VISIT1-3是3,两者相乘是2*3,再加个1残差
Z:为0是因为这没有指定随机效应。
Max Obs per Subject: 每个Subject几个观测
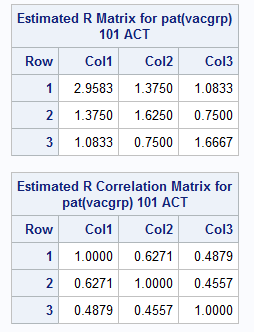
R和RCORR to get an idea of any patterns that might exist in the correlations across time。
可通r Rcorr,看下是否和TYPE中指定的协方差结构吻合。这里的协方差就是任意两个时点(VISIT)的关系。
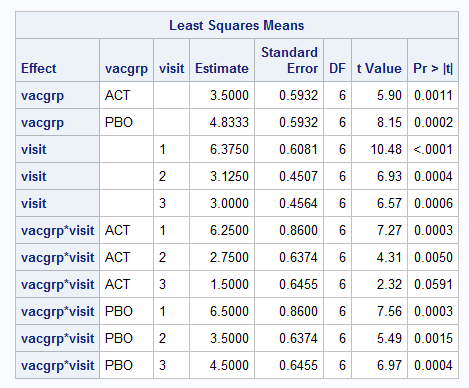
Estimate就是最小二乘均值,Standard Error是标准误,后面的t分数是Estimate / Standard Error。也就是单样本 t 检验。
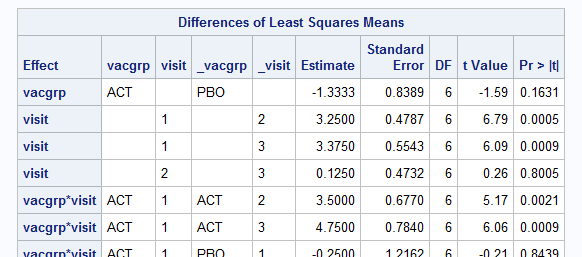
两样本 t 检验。
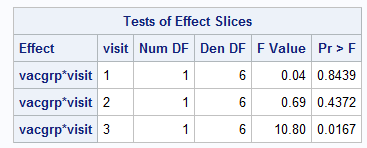
相当于by visit,方差分析。
两个group之间的chage比较
本文来自博客园,作者:Iving,转载请注明原文链接:https://www.cnblogs.com/SAS-T/p/15540149.html
