SAS Draw 综合应用
xpace yspace 详见
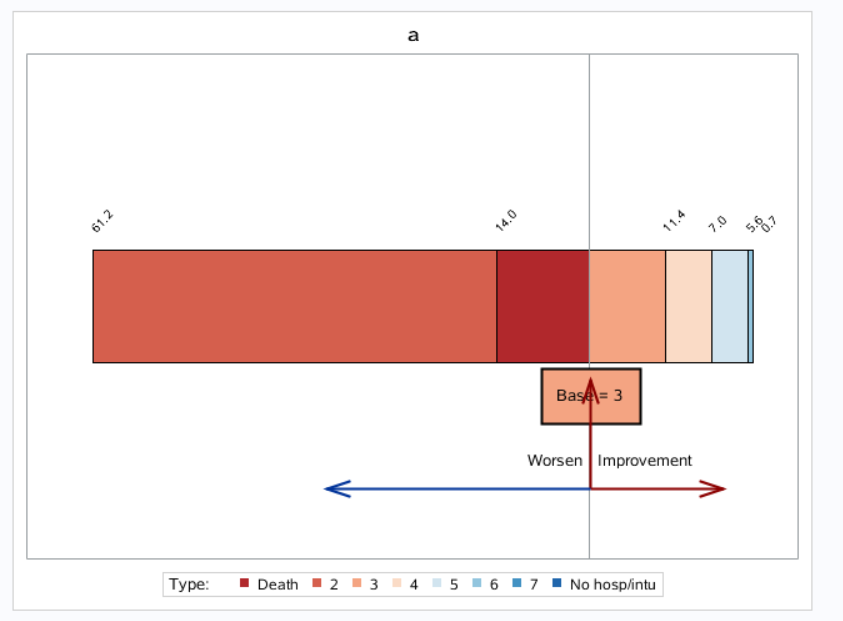
SAS draw statement
data cars;
    set sashelp.cars;
    cat1 = 'Improvemnt';
    cat2 = 'Worsen';
    if type = 'SUV' then typen = 1;
        else if type = 'Sedan' then typen = 2;
        else if type = 'Sports' then typen = 3;
        else if type = 'Wagon' then typen = 4;
        else if type = 'Truck' then typen = 5;
        else if type = 'Hybrid' then typen = 6;

run;

proc freq data = cars;
by cat1;
tables type*typen / out = cars_freq;
run;

data cars_freq;
    set cars_freq;
    if typen = 3 then type = "Base";
    percentc = strip(put(percent,4.1));
    if typen < 3 then do;percent = -percent;/*typen = -typen;*/subcatn = -1;end;
        else subcatn = 1;
    typec = strip(put(typen,best.));
run;

proc sort data = cars_freq;by subcatn typen;
run;

data cars_freq;
    set cars_freq;
    by subcatn typen;
    lagp = lag(percent);
    if first.subcatn and typen < 3 then cumPercent1 = percent ;
        else if typen < 3 then cumPercent1 + percent;
        else cumPercent1 = .;
    if first.subcatn and typen >= 3 then  cumPercent2 = percent ;
        else if typen > 3 then cumPercent2 + percent;
        else cumPercent2 = .;
run;

data cars_freq;
    set cars_freq;
    cumPercent = strip(put(coalesce(cumPercent1,cumPercent2),5.1));
    cumPercentn = coalesce(cumPercent1,cumPercent2);
    if typen = 6 then cumPercentn = cumPercentn + 1.5;
run;

ods html;

proc template;
define statgraph _barchart;
begingraph /;
dynamic _val;
*自定义每个group的值的具体属性;
discreteattrmap name = "selfName1";
        value "1" / fillattrs=(color=cxb1282c  );
        value "2" / fillattrs=(color=cxd55f4d  );
        value "3" / fillattrs=(color=cxf4a482  );
        value "4" / fillattrs=(color=cxfadbc6  );
        value "5" / fillattrs=(color=cxd1e4ef  );
        value "6" / fillattrs=(color=cx92c5de  );
        value "7" / fillattrs=(color=cx4392c3   );
        value "8" / fillattrs=(color=cx2066ac  );
enddiscreteattrmap;

discreteattrvar attrvar = selfName2 var = typec attrmap=  "selfName1";

*自定义legend;
   legenditem type=marker name="1"/ label='Death' markerattrs=(color=cxb1282c symbol=squarefilled);
   legenditem type=marker name="2"/ label='2' markerattrs=(color=cxd55f4d symbol=squarefilled);
   legenditem type=marker name="3"/ label='3'  markerattrs=(color=cxf4a482 symbol=squarefilled);
   legenditem type=marker name="4"/ label='4' markerattrs=(color=cxfadbc6 symbol=squarefilled);
   legenditem type=marker name="5"/ label='5' markerattrs=(color=cxd1e4ef symbol=squarefilled);
   legenditem type=marker name="6"/ label='6' markerattrs=(color=cx92c5de symbol=squarefilled);
   legenditem type=marker name="7"/ label='7' markerattrs=(color=cx4392c3 symbol=squarefilled);
   legenditem type=marker name="8"/ label='No hosp/intu' markerattrs=(color=cx2066ac symbol=squarefilled);
    entrytitle "a";
    layout overlay / xaxisopts = (display =  none ) yaxisopts = (display =  none )
                    x2axisopts = (display =  none ) y2axisopts = (display =  none );
        barchart category = cat1 response = percent / group = selfName2 yaxis = y2  orient = horizontal outlineattrs=(color=black)
                        grouporder=ascending groupdisplay = stack barwidth = 0.3 /*barlabel = true*/ name = "a";

        textplot y = cat1 x = eval(cumPercentn) text = eval(strip(put(abs(percent),4.1))) / POSITION=right   rotate=45 DISCRETEOFFSET=0.2;

        drawtext "Worsen" / width = 10 anchor = right x = - 0.5 y = 25 xspace = datavalue ;
        drawtext "Improvement" / width = 100 anchor = left x = 0.5 y = 25 xspace = datavalue ;

        drawrectangle x = 0 y = 32 height = 10 width = 14 / xspace = datavalue yspace = layoutpercent anchor = bottom
                                                    display = all fillattrs = (color = cxf4a482)
                                                    outlineattrs = (color = black) transparency = 0;
        drawtext "Base = 3" / width = 15 anchor = bottom x = 0 y = 35 xspace = datavalue yspace = layoutpercent;

        drawarrow x1 = 0 y1 = 20 x2 = 0 y2 = 40 / x1space = datavalue x2space = datavalue y1space = layoutpercent y2space = layoutpercent  lineattrs=(color=darkred);
        drawarrow x1 = 0 y1 = 20 x2 = 20 y2 = 20 / x1space = datavalue x2space = datavalue y1space = layoutpercent y2space = layoutpercent  lineattrs=(color=darkred);
        drawarrow x1 = 0 y1 = 20 x2 = -40 y2 = 20 / x1space = datavalue x2space = datavalue y1space = layoutpercent y1space = layoutpercent;


        discretelegend '1' '2' '3' '4' '5' '6' '7' '8'/ title = "Type: ";
    endlayout;
endgraph;
end;
run;
 /*SEGMENTLABEL=true SEGMENTLABELFITPOLICY=NONE SEGMENTLABELFORMAT=percnt. */

proc sgrender data = cars_freq template = _barchart;
run;
本文来自博客园,作者:Iving,转载请注明原文链接:https://www.cnblogs.com/SAS-T/p/15389747.html

 浙公网安备 33010602011771号