SAS draw statement
通过draw画矩形,文本,箭头等。
anchor = 矩形在坐标点的哪边。
drawspace = 相当于找一个基准点。是从figure最左下角作为基准点,还是坐标原点作为基准点,还是其它作为基准点。
draw中的 x = y = 并不是对应X Y轴上位置,而是基于上述基准点计算。

例如datapercent datapixel等。
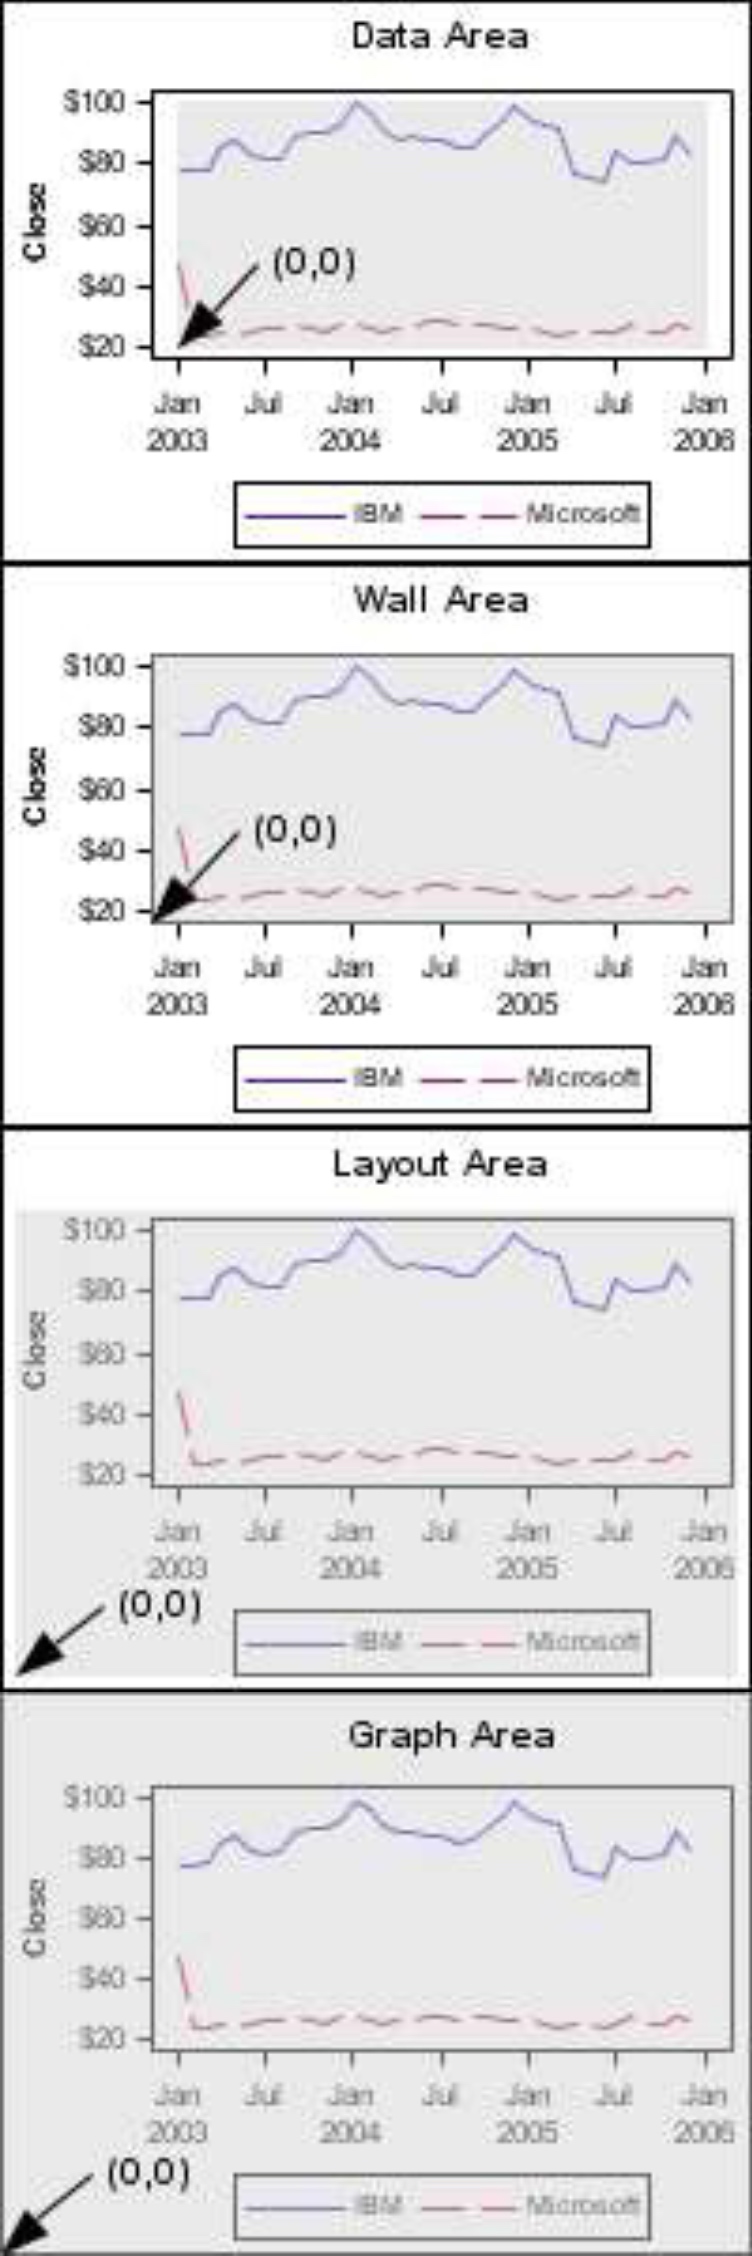
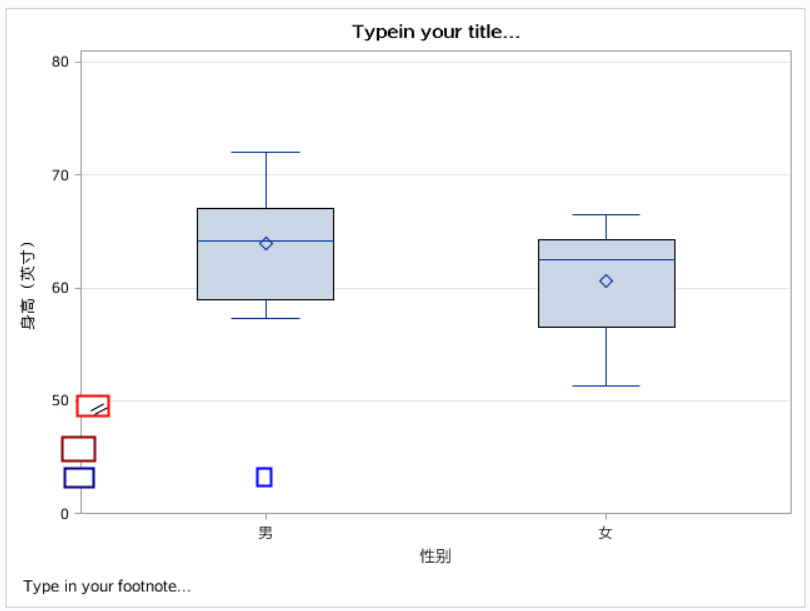
下图中的四个draw只是..SPACE选项不同。
ods html;

proc template;
define statgraph sgdesign;
dynamic _SEX _HEIGHT;begingraph;
entrytitle halign=center 'Typein your title...';
entryfootnote halign=left'Type in your footnote...';
    layout overlay / yaxisopts=( type=linear offsetmin=0.0 griddisplay=on
                    linearopts=( viewmin=0.0 viewmax=80.0 minorgrid=OFF minorticks=OFF tickvaluepriority=TRUE
                                tickvalueformat=BEST6. tickvaluelist=(40.0 50.0 60.0 70.0 80.0)
                                    tickdisplaylist=("0" "50" "60" "70" "80") ) );
        boxplot x=_SEX y=_HEIGHT / name='box' groupdisplay=Cluster;
        drawrectangle x=58 y=128 width=4 height=4 / display=all outlineattrs=(color=red) fillattrs=(color=white)
                                                    transparency=0 anchor=center drawspace=layoutpixel;

        drawrectangle x=58 y=128 width=4 height=4 / display=all outlineattrs=(color=darkred) fillattrs=(color=white)
                                                    transparency=0 anchor=center drawspace=graphpixel;

        drawrectangle x=-2 y=30 width=4 height=4 / display=all outlineattrs=(color=blue) fillattrs=(color=white)
                                                    transparency=0 anchor=center
                                                    xspace = datapixel yspace = datapixel;

        drawrectangle x=-2 y=30 width=4 height=4 / display=all outlineattrs=(color=darkblue) fillattrs=(color=white)
                                                    transparency=0 anchor=center
                                                    xspace = wallpixel yspace = wallpixel;

        drawtext textattrs=(size=12pt)"//" / x=59 y=130 rotate=-45 drawspace=layoutpixel anchor=left border=false
                                                TRANSPARENCY=0;
    endlayout;
endgraph;
end;
run;


proc sgrender data=SASHELP.CLASS template=sgdesign;
dynamic _SEX="SEX" _HEIGHT="HEIGHT";
run;
本文来自博客园,作者:Iving,转载请注明原文链接:https://www.cnblogs.com/SAS-T/p/15376318.html

 浙公网安备 33010602011771号