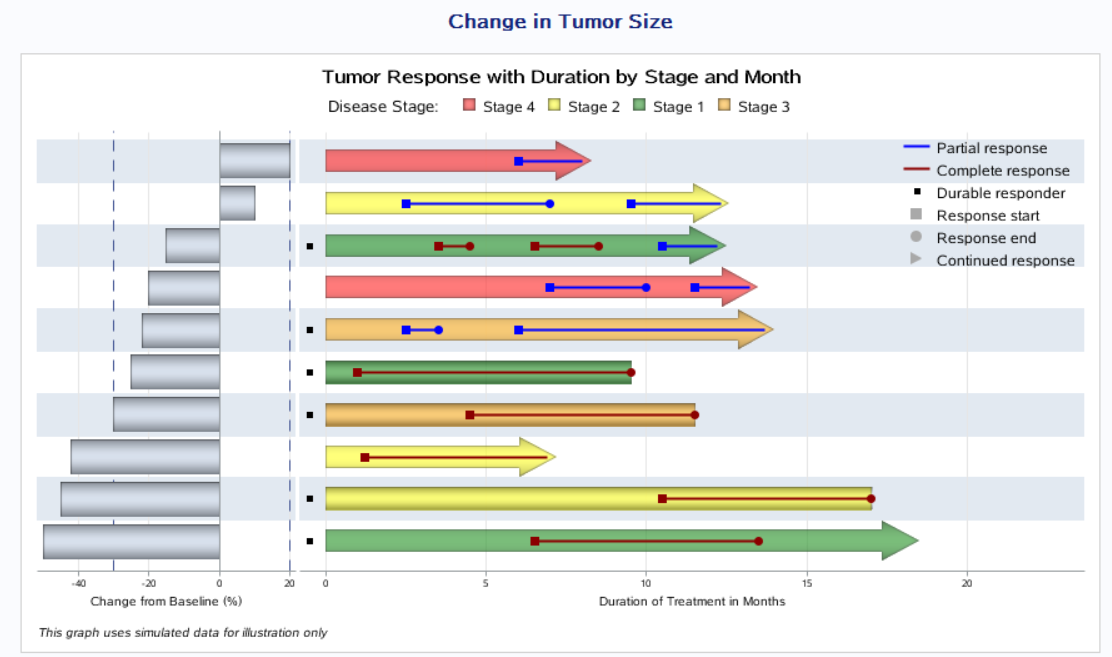
SAS swimmer泳图
第一部分:LEGENDITEM是自定义一个legend。
第二部分:LAYOUT LATTICE就是把画布分成了两列。ROWDATARANGE = union就是Y轴都是一个尺度。REVERSE = True从上到下,Y轴值依次增大
第三部分:画出左边的图形。tickValuePriority = True显示最末尾刻度的刻度值。
第四部分:第一个HIGHLOWPLOT是画出条形图,第二个是画出条形图中的线条。HIGHCAP是画出high的箭头,这次默认LOWCAP = NONE即low啥都没有,不画箭头啥的。三个SCATTERPLOT分别画出各种 marker。
第五部分:SIDEBAR在layout lattice中用来entry文本、显示legend。图示sidebar。
%let dpi=300;

/*--Data for Swimmer Plot--*/
data swimmer;
  label response='Change from Baseline (%)';
  input item stage $4-12 low high highcap $25-40 status $40-60 start end durable response;
  startline=start; endline=end;
  if status ne ' ' then do;
    if end eq . then endline=high-0.3;
    if start eq . then startline=low+0.3;
  end;
  if stage eq ' ' then durable=.;
  datalines;
1  Stage 1  0  18.5     FilledArrow     Complete response      6.5  13.5  -0.25  -50
2  Stage 2  0  17.0                     Complete response     10.5  17.0  -0.25  -45
3  Stage 3  0  14.0     FilledArrow     Partial response       2.5   3.5  -0.25  -22
3           0  14.0     FilledArrow     Partial response       6.0     .  -0.25  -22
4  Stage 4  0  13.5     FilledArrow     Partial response       7.0  10.0     .   -20
4           0  13.5     FilledArrow     Partial response      11.5     .     .   -20
5  Stage 1  0  12.5     FilledArrow     Complete response      3.5   4.5  -0.25  -15
5           0  12.5     FilledArrow     Complete response      6.5   8.5  -0.25  -15
5           0  12.5     FilledArrow     Partial response      10.5     .  -0.25  -15
6  Stage 2  0  12.6     FilledArrow     Partial response       2.5   7.0     .    10
6           0  12.6     FilledArrow     Partial response       9.5     .     .    10
7  Stage 3  0  11.5                     Complete response      4.5  11.5  -0.25  -30
8  Stage 1  0   9.5                     Complete response      1.0   9.5  -0.25  -25
9  Stage 4  0   8.3     FilledArrow     Partial response       6.0     .     .    20
10 Stage 2  0   7.2     FilledArrow     Complete response      1.2     .     .   -42
;
run;

data attrmap;
length ID $ 9 linecolor markercolor fillcolor $ 10;
input id $ value $10-30 linecolor $ markercolor $ fillcolor $;
show='ATTRMAP';
datalines;
status   Complete response    darkred   darkred  gray
status   Partial response     blue      blue     gray
stage    Stage 1              darkred   darkred  green
stage    Stage 2              black     black    yellow
stage    Stage 3              black     black    orange
stage    Stage 4              black     black    red
;
run;

proc sort data=swimmer out=swimmer_sort;
  by descending response;
run;

data swimmer_sort_2;
  retain prev id 0;
  set swimmer_sort;
  if item ne prev then id+1;
  prev=item;
  durable=durable*2;
run;


ODS HTML;


/*--Horizontal Swimmer with Duration--*/
proc template;
  define statgraph Swimmer_Plus_Horizontal;
    begingraph / ;
      entrytitle 'Tumor Response with Duration by Stage and Month';
      entryfootnote halign=left 'This graph uses simulated data for illustration only' /
           textattrs=(size=7pt style=italic);
*第一部分;
      legenditem type=marker name='ResStart' / markerattrs=(symbol=squarefilled color=darkgray size=9)
             label='Response start' ;
      legenditem type=marker name='ResEnd' / markerattrs=(symbol=circlefilled color=darkgray size=9)
             label='Response end';
      legenditem type=marker name='RightArrow' / markerattrs=(symbol=trianglerightfilled color=darkgray size=9)
             label='Continued response';
*第二部分;
      layout lattice / rowdatarange=union columnweights=(0.25 0.75) columngutter=0 columns=2;
        rowaxes;
          rowaxis / display=none type=discrete reverse=true discreteopts=(colorbands=odd colorbandsattrs=(transparency=0.1));
        endrowaxes;
*第三部分;
        layout overlay / xaxisopts=(griddisplay=on tickvalueattrs=(size=6) labelattrs=(size=7)
                                    linearopts=(tickvaluepriority=true) label='Change from Baseline (%)')
                                    walldisplay=none;
          bandplot y=id limitupper=20 limitlower=-30 / extend=true display=(outline )
                       outlineattrs=graphdata1(pattern=dash thickness=1);
          barchartparm category=id response=response / barwidth=0.8 orient=horizontal
                       datalabelattrs=(size=5) dataskin=pressed ;
        endlayout;
*第四部分;
        layout overlay / xaxisopts=(griddisplay=on offsetmax=0.15 tickvalueattrs=(size=6)
                                    labelattrs=(size=7)  label='Duration of Treatment in Months') walldisplay=none;

          highlowplot y=id low=low high=high / highcap=highcap type=bar group=stage dataskin=pressed
              lineattrs=(color=black) name='stage' barwidth=1.0 includemissinggroup=false datatransparency=0.3;
          highlowplot y=id low=startline high=endline / group=status lineattrs=(thickness=2 pattern=solid)
            name='status' includemissinggroup=false;
          scatterplot y=id x=durable / markerattrs=(symbol=squarefilled size=6 color=black) name='Durable' legendlabel='Durable responder';
          scatterplot y=id x=start / markerattrs=(symbol=squarefilled size=8) group=status;
          scatterplot y=id x=end / markerattrs=(symbol=circlefilled size=8) group=status;
/*          discretelegend 'stage' / valign=top title='Disease Stage' border=false title='Stage:';*/
          discretelegend 'status' 'Durable' 'ResStart' 'ResEnd'  'RightArrow' / valueattrs=(size=9)
                     halign=right valign=top border=false location=inside across=1 itemsize=(linelength=20);

        endlayout;
*第五部分;
        sidebar / align=top spacefill=true;
          discretelegend 'stage' / title='Disease Stage:' border=false;
        endsidebar;
      endlayout;
    endgraph;
  end;
run;

ods graphics / reset width=9in height=5in imagename='Swimmer_Plus_Horizontal';
proc sgrender template=Swimmer_Plus_Horizontal data=swimmer_sort_2 dattrmap=attrmap;
/*format duration 3.0;*/
label response='Response';
dattrvar stage='stage' status='status';
run;


/*--Vertical Swimmer with Duration--*/
proc template;
  define statgraph Swimmer_With_Response_Vertical;
    begingraph / ;
      entrytitle 'Tumor Response with Duration by Stage and Month';
      entryfootnote halign=left 'This graph uses simulated data for illustration only' /
                                       textattrs=(size=7pt style=italic);

      legenditem type=marker name='ResStart' / markerattrs=(symbol=squarefilled color=darkgray size=7)
             label='Response start';
      legenditem type=marker name='ResEnd' / markerattrs=(symbol=circlefilled color=darkgray size=7)
             label='Response end';
      legenditem type=marker name='RightArrow' / markerattrs=(symbol=trianglefilled color=darkgray size=12)
             label='Continued response';

      layout lattice / columndatarange=union rowweights=(0.6 0.4) rowgutter=0;
        columnaxes;
          columnaxis / display=none type=discrete discreteopts=(colorbands=odd colorbandsattrs=(transparency=0.1));
        endcolumnaxes;
        layout overlay / yaxisopts=(griddisplay=on offsetmax=0.15 tickvalueattrs=(size=7)
                                    labelattrs=(size=8)  label='Duration of Treatment in Months') walldisplay=none;

          highlowplot x=id low=low high=high / group=stage highcap=highcap type=bar dataskin=pressed
                                              lineattrs=(color=black) name='stage' barwidth=0.8
                                            includemissinggroup=false datatransparency=0.3;
          highlowplot x=id low=startline high=endline / group=status lineattrs=(thickness=2 pattern=solid)
                                                        name='status' includemissinggroup=false;
            scatterplot x=id y=durable / markerattrs=(symbol=squarefilled size=6 color=black) name='Durable' legendlabel='Durable responder';
            scatterplot x=id y=start / markerattrs=(symbol=squarefilled size=8) group=status;
            scatterplot x=id y=end / markerattrs=(symbol=circlefilled size=8) group=status;
            discretelegend 'stage' / title='Disease Stage' valign=top border=false title='Stage:';
            discretelegend 'status' 'Durable' 'ResStart' 'ResEnd'  'RightArrow' / order=columnmajor
                                                                 halign=left valign=top border=false
                                                                location=inside down=3 itemsize=(linelength=20);

        endlayout;
        layout overlay / yaxisopts=(griddisplay=on tickvalueattrs=(size=7) labelattrs=(size=8) offsetmax=0
                                    linearopts=(tickvaluepriority=true) label='Change from Baseline (%)')
                                    walldisplay=none;
          bandplot x=id limitupper=20 limitlower=-30 / extend=true display=(outline)
                       outlineattrs=graphdata1(pattern=dash thickness=1);
          barchartparm category=id response=response / barwidth=0.5
                       datalabelattrs=(size=5) dataskin=pressed ;
        endlayout;
      endlayout;
    endgraph;
  end;
run;

ods graphics / reset width=9in height=5in imagename='Swimmer_Plus_Vertical';

proc sgrender template=Swimmer_With_Response_Vertical data=swimmer_sort_2 dattrmap=attrmap;
/*format duration 3.0;*/
label response='Response';
dattrvar stage='stage' status='status';
run;

本文来自博客园,作者:Iving,转载请注明原文链接:https://www.cnblogs.com/SAS-T/p/15375891.html


