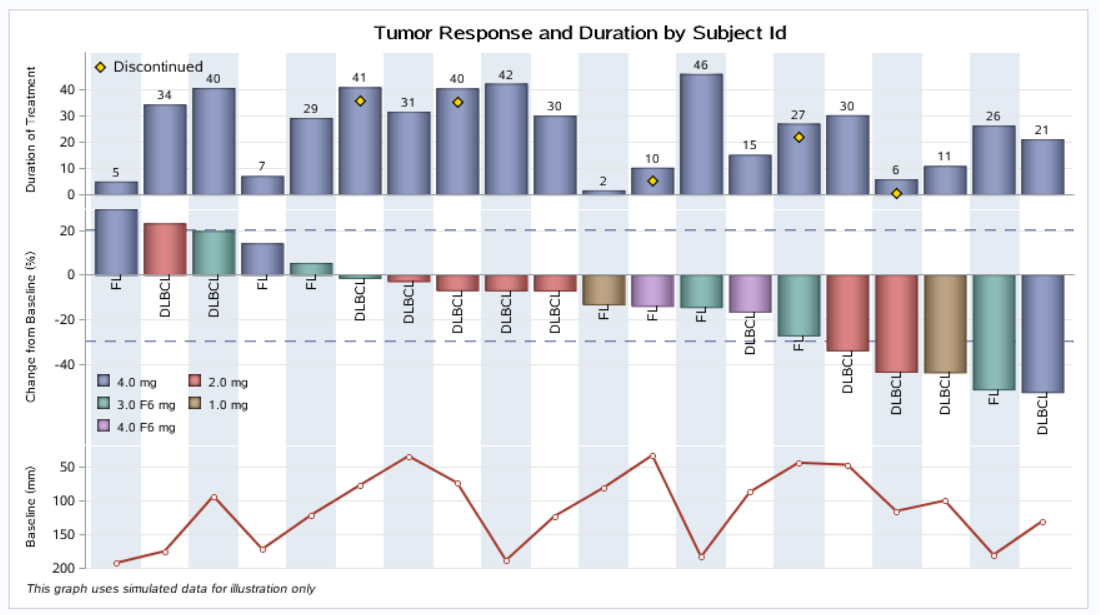
SAS waterfall瀑布图
第一部分:统一X轴,只用一个标准。DISPLAY = NONE啥也不显示了。COLORBANDS = ODD隔行换色
第二部分:
filledoutlinedmarkers=true markerfillattrs=(color=gold)
                      markeroutlineattrs=(color=black)
      marker有边框,边框色和填充色不一致。
第三部分:BANDPLOT是figure中上下两条蓝色虚线。extend = true会在末尾多延长一点点,在survival plot中和STEPPLOT连用时看起来明显。DATALABELFITPOLICY就是如何显示datalabel。
TEXTPLOT就是把把数据以文本形式展现在figure中。
第四部分:
在GitHub看到的例子,分享在这。
data attrmap中的ID VALUE是必须的,ID必须排序。在PROC SGRENDER中 dattrmap=attrmap dattrvar = ""会调用这些自定义的属性
proc format;
  value res
    0='1.0 mg'
    1='2.0 mg'
    2='3.0 mg'
    3='4.0 mg'
    4='3.0 F6 mg'
    5='4.0 F6 mg';
run;

/*--Create some data--*/
data tumor;
  label Duration='Duration of Treatment' Dropped='Discontinued';
  format Drug res.;
  length Code $6;
  do i=1 to 20;
    Response=100*(ranuni(3)-0.7);
    Duration=50*ranuni(3);
    Dropped=.;
    if ranuni(3) > 0.8 then Dropped=duration-5;
    Drug=floor(6*ranuni(3));
    if ranuni(3) > 0.7 then Code='FL';
    else Code='DLBCL';
    codeloc=ifn(response > 0, 0, response);
    baseline=20+180*(ranuni(2));
    output;
  end;
run;

/*--Sort by descending response--*/
proc sort data=tumor out=tumor;
  by descending Response;
run;

data tumorsorted;
  set tumor;
  j=_n_;
run;

ods html;

/*--Define Attributes map for walls and axes--*/
data attrmap;
  length ID $ 9 value $10 fillcolor $ 10 show $8;
  id='Resp';  value='1.0 mg';     fillcolor='white'; show='Attrmap'; output;
  id='Resp';  value='2.0 mg';     fillcolor='cxffffc0'; show='Attrmap'; output;
  id='Resp';  value='3.0 mg';     fillcolor='cxf0d0a0'; show='Attrmap'; output;
  id='Resp';  value='4.0 mg';     fillcolor='orange'; show='Attrmap'; output;
  id='Resp';  value='3.0 F6 mg';  fillcolor='cxff7f00'; show='Attrmap'; output;
  id='Resp';  value='4.0 F6 mg';  fillcolor='red'; show='Attrmap'; output;
run;


/*--WaterFall with Tumor Baseline--*/
proc template;
  define statgraph Waterfall_Baseline_Series;
    begingraph / subpixel = on;
      entrytitle 'Tumor Response and Duration by Subject Id';
      entryfootnote halign=left 'This graph uses simulated data for illustration only' /
           textattrs=(size=7pt style=italic);
      layout lattice / columndatarange=union rowweights=(0.3 0.45 0.25) rowgutter=0;
*第一部分;
        columnaxes;
          columnaxis / display=none discreteopts=(colorbands=odd colorbandsattrs=(transparency=0.2));
        endcolumnaxes;
*第二部分;
        layout overlay / yaxisopts=(griddisplay=on offsetmax=0.15 tickvalueattrs=(size=8) labelattrs=(size=7)) walldisplay=none;
          barchartparm category=j response=duration / datalabel=duration
                       fillattrs=graphdata1 datalabelattrs=(size=7)
                       dataskin=pressed /*displaybaseline=auto*/;
          scatterplot x=j y=dropped / markerattrs=(symbol=diamondfilled size=11)
                      filledoutlinedmarkers=true markerfillattrs=(color=gold)
                      markeroutlineattrs=(color=black) name='d' legendlabel='Discontinued';
          discretelegend 'd' / location=inside valign=top halign=left valueattrs=(size=9)
                               border=false autoitemsize=true;
        endlayout;
*第三部分;
        layout overlay / yaxisopts=(griddisplay=on tickvalueattrs=(size=8) labelattrs=(size=7) offsetmax=0
                                    linearopts=(tickvaluepriority=true) label='Change from Baseline (%)')
                                    walldisplay=none;
          bandplot x=j limitupper=20 limitlower=-30 / extend=true display=(outline)
                       outlineattrs=graphdata1(pattern=dash thickness=1);
          barchartparm category=j response=response / group=drug groupdisplay=cluster
                       datalabelattrs=(size=5) dataskin=pressed name='a' datalabelfitpolicy=rotate;
          textplot x=j y=codeloc text=code / rotate=90 position=left textattrs=(size=8) contributeoffsets=(ymin);
          discretelegend 'a' / location=inside valign=bottom halign=left across=2 opaque=false
                         valueattrs=(size=7) border=false;
        endlayout;
*第四部分;
        layout overlay / yaxisopts=(griddisplay=on tickvalueattrs=(size=8) labelattrs=(size=7) offsetmax=0
                                    linearopts=(tickvaluepriority=true) reverse=true)
                                    walldisplay=none;
          seriesplot x=j y=baseline / lineattrs=graphdata2(pattern=solid thickness=2);
          scatterplot x=j y=baseline / markerattrs=(symbol=circlefilled size=7)
                      filledoutlinedmarkers=true markerfillattrs=(color=white)
                      markeroutlineattrs=graphdata2;
        endlayout;
      endlayout;
    endgraph;
  end;
run;

ods graphics / reset width=9in height=5in imagename='Waterfall_Baseline_Series';
proc sgrender template=Waterfall_Baseline_Series data=tumorsorted dattrmap=attrmap;
format duration 3.0;
label baseline='Baseline (mm)';
dattrvar drug="Resp";
run;


/*--WaterFall with Tumor Baseline--*/
proc template;
  define statgraph Waterfall_Baseline_Needle;
    begingraph / ;
      entrytitle 'Tumor Response and Duration by Subject Id';
      entryfootnote halign=left 'This graph uses simulated data for illustration only' /
           textattrs=(size=7pt style=italic);
      layout lattice / columndatarange=union rowweights=(0.3 0.45 0.25) rowgutter=0;
        columnaxes;
          columnaxis / display=none discreteopts=(colorbands=odd colorbandsattrs=(transparency=0.2));
        endcolumnaxes;
        layout overlay / yaxisopts=(griddisplay=on offsetmax=0.15 tickvalueattrs=(size=7) labelattrs=(size=7)) walldisplay=none;
          barchartparm category=j response=duration / datalabel=duration
                       fillattrs=graphdata1 datalabelattrs=(size=5)
                       dataskin=pressed /*displaybaseline=auto*/;
          scatterplot x=j y=dropped / markerattrs=(symbol=diamondfilled size=9)
                      filledoutlinedmarkers=true markerfillattrs=(color=gold)
                      markeroutlineattrs=(color=black) name='d' legendlabel='Discontinued';
          discretelegend 'd' / location=inside valign=top halign=left valueattrs=(size=7)
                               border=false autoitemsize=true;
        endlayout;
        layout overlay / yaxisopts=(griddisplay=on tickvalueattrs=(size=5) labelattrs=(size=7) offsetmax=0
                                    linearopts=(tickvaluepriority=true)  label='Change from Baseline (%)')
                                    walldisplay=none;
          bandplot x=j limitupper=20 limitlower=-30 / extend=true display=(outline)
                       outlineattrs=graphdata1(pattern=dash thickness=1);
          barchartparm category=j response=response / group=drug groupdisplay=cluster
                       datalabelattrs=(size=5) dataskin=pressed name='a' datalabelfitpolicy=rotate;
          textplot x=j y=codeloc text=code / rotate=90 position=left textattrs=(size=6) contributeoffsets=(ymin);
          discretelegend 'a' / location=inside valign=bottom halign=left across=2 opaque=false
                         valueattrs=(size=5) border=false;
        endlayout;
        layout overlay / yaxisopts=(griddisplay=on tickvalueattrs=(size=5) labelattrs=(size=7) offsetmin=0
                                    linearopts=(tickvaluepriority=true))
                                    walldisplay=none;
          needleplot x=j y=baseline / lineattrs=(color=green pattern=solid thickness=3);
          scatterplot x=j y=baseline / markerattrs=(symbol=circlefilled size=7)
                      filledoutlinedmarkers=true markerfillattrs=(color=white)
                      markeroutlineattrs=(color=green);
        endlayout;
      endlayout;
    endgraph;
  end;
run;

ods graphics / reset width=4in height=4in imagename='Waterfall_Baseline_Needle';
proc sgrender template=Waterfall_Baseline_Needle data=tumorsorted dattrmap=attrmap;
format duration 3.0;
label baseline='Baseline (mm)';
dattrvar drug="Resp";
run;
本文来自博客园,作者:Iving,转载请注明原文链接:https://www.cnblogs.com/SAS-T/p/15375785.html

 浙公网安备 33010602011771号