
SAS forest森图综合
Code大致由四部分组成
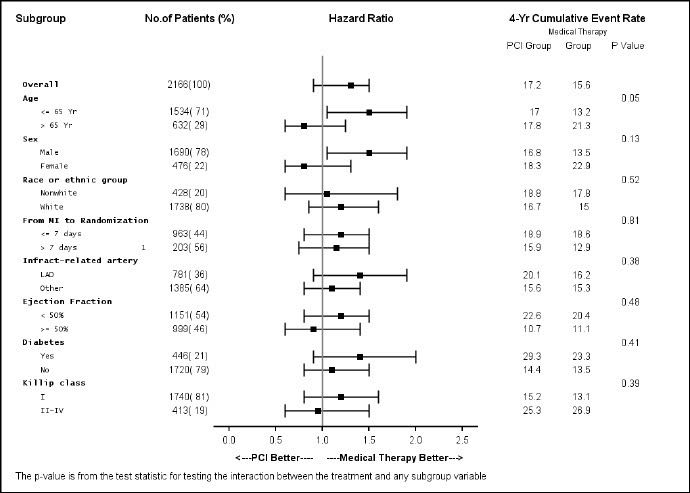
First Part: 把 SIDEBAR 区域分成两行四列,分别输入entry。这里默认 order = rowmajor,即先按水平方向填充entry。
siderbar区域啥意思,可参考SAS lattice_2中的图。
Second Part: 用SCATTERPLOT 把数据集的数据画出来。其实一个SCATTERPLOT也可以画出所有数据,之所以有两个,是因为第二个SCATTERPLOR需要控制背景色(暗灰色)。
Third Part: 用SCATTERPLOT画出点和95%区间。
Fourth Part: 用SCATTERPLOT画出数据集中数据。xaxis = x2就是用到了副坐标轴,把label显示在了上面,否则就会显示在下面。
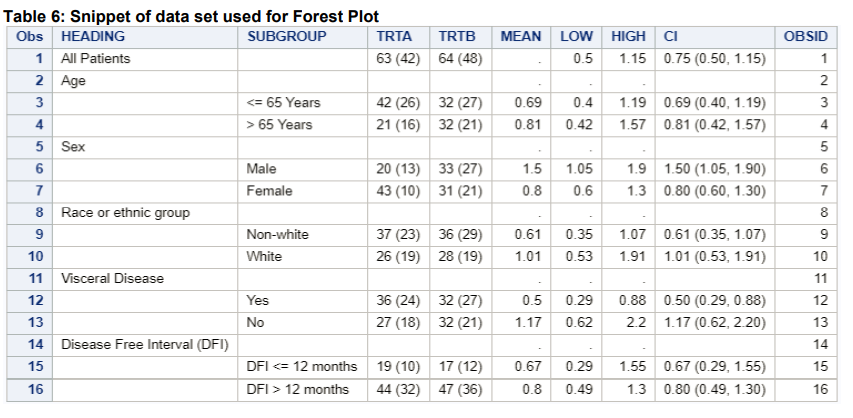
数据集都是提前整理好的,非常费时间。这些例子都是在sasblog中找的零散例子,分享给大家。
proc template;
define statgraph Forest;
dynamic _bandcolor _headercolor _subgroupcolor;
begingraph;
layout lattice / columns=4 columnweights=(0.23 0.07 0.4 0.3);

*第一部分;
            sidebar / align=top;
                layout lattice / rows=2 columns=4 columnweights=(0.18 0.17 0.350.3) backgroundcolor=_headercolor opaque=true;
                    entry textattrs=(size=8 weight=bold) halign=left "Subgroup";
                    entry textattrs=(size=8 weight=bold) " No.of Patients (%)";
                    entry textattrs=(size=8 weight=bold) "Hazard Ratio";
                    entry halign=center textattrs=(size=8 weight=bold) "4-Yr CumulativeEvent Rate" ;
                    entry " ";
                    entry " ";
                    entry "";
                    entry halign=center textattrs=(size=6) "Medical Therapy";
                endlayout;
            endsidebar;
*第二部分;
            layout overlay / walldisplay=none xaxisopts=(display=none) yaxisopts=(reverse=true display=none
                    tickvalueattrs=(weight=bold));
                referenceline y=ref / lineattrs=(thickness=15 color=_bandcolor);
                scatterplot y=obsid x=zero / markercharacter=subgroup markercharacterattrs=(family='Lucida Console' size=6);
                scatterplot y=obsid x=zero / markercharacter=heading markercharacterattrs=(family='Lucida Console' size=6 color=_subgroupcolor weight=bold);
            endlayout;

            layout overlay / xaxisopts=(display=none) yaxisopts=(reverse=true display=none) walldisplay=none;
                referenceline y=ref / lineattrs=(thickness=15 color=_bandcolor);
                scatterplot y=obsid x=zero /markercharacter=countpct markercharacterattrs=graphvaluetext;
            endlayout;
*第三部分;
            layout overlay /xaxisopts=(label=' <---PCIBetter---- ----Medical TherapyBetter--->' linearopts=(tickvaluepriority=true tickvaluelist=(0.0 0.5 1.0 1.5 2.0 2.5)))
                        yaxisopts=(reverse=true display=none) walldisplay=none;
                referenceline y=ref / lineattrs=(thickness=15 color=_bandcolor);
                scatterplot y=obsid x=mean / xerrorlower=low xerrorupper=high markerattrs=(symbol=squarefilled);
                referenceline x=1;
            endlayout;
*第四部分;
            layout overlay / x2axisopts=(display=(tickvalues) offsetmin=0.25 offsetmax=0.25) yaxisopts=(reverse=true display=none)
                            walldisplay=none;
                referenceline y=ref / lineattrs=(thickness=15 color=_bandcolor);
                scatterplot y=obsid x=pci_lbl / markercharacter=PCIGroup xaxis=x2 markercharacterattrs=graphvaluetext;
                scatterplot y=obsid x=grp_lbl / markercharacter=group xaxis=x2 markercharacterattrs=graphvaluetext;
                scatterplot y=obsid x=pval_lbl / markercharacter=pvalue xaxis=x2 markercharacterattrs=graphvaluetext;
            endlayout;
endlayout;
entryfootnote halign=left textattrs=(size=7) 'The p-value is from the test statistic for testing the interactionbetween the ' 'treatment and any subgroup variable';
endgraph;
end;
run;
data forest_subgroup;
label PCIGroup='PCI Group' Group='Therapy Group';
input Id Subgroup $3-27 Count Percent Mean Low High PCIGroup Group PValue;
datalines;
1 Overall 2166 100 1.3 0.9 1.5 17.2 15.6 .
1 Age . . . . . . . 0.05
2 <= 65 Yr 1534 71 1.5 1.05 1.9 17.0 13.2 .
2 > 65 Yr 632 29 0.8 0.6 1.25 17.8 21.3 .
1 Sex . . . . . . . 0.13
2 Male 1690 78 1.5 1.05 1.9 16.8 13.5 .
2 Female 476 22 0.8 0.6 1.3 18.3 22.9 .
1 Race or ethnic group . . . . . . . 0.52
2 Nonwhite 428 20 1.05 0.6 1.8 18.8 17.8 .
2 White 1738 80 1.2 0.85 1.6 16.7 15.0 .
1 From MI to Randomization . . . . . . . 0.81
2 <= 7 days 963 44 1.2 0.8 1.5 18.9 18.6 .
2 > 7 days 1203 56 1.15 0.75 1.5 15.9 12.9 .
1 Diabetes . . . . . . . 0.41
2 Yes 446 21 1.4 0.9 2.0 29.3 23.3 .
2 No 720 79 1.1 0.8 1.5 14.4 13.5 .
;
run;
/*--Set indent weight, add insets and horizontal bands--*/
data forest_subgroup_2;
set forest_subgroup end=last;
label countPct='No. of Patients (%)';
length tValue $20 tPos $8;
drop Count Percent val;
yVal=_n_;
if count ne . then CountPct=put(count, 4.0) || "(" || put(percent, 3.0) || ")";
indentWt=ifn(id EQ 1, 0, 1); /* indent sub headings */
val=mod(_N_-1, 6);
if val in (1:3) then ref=yVal;
output;
if last then do;
call missing (Id, subGroup, mean, low, high, pcigroup, group, countPct, indentWt, ref);
yVal+1;
xl=0.9; tValue='<--PCI Better'; tPos='left'; output;
xl=1.1; tValue='Therapy Better-->'; tPos='right'; output;
end;
run;
本文来自博客园,作者:Iving,转载请注明原文链接:https://www.cnblogs.com/SAS-T/p/15375713.html

 浙公网安备 33010602011771号