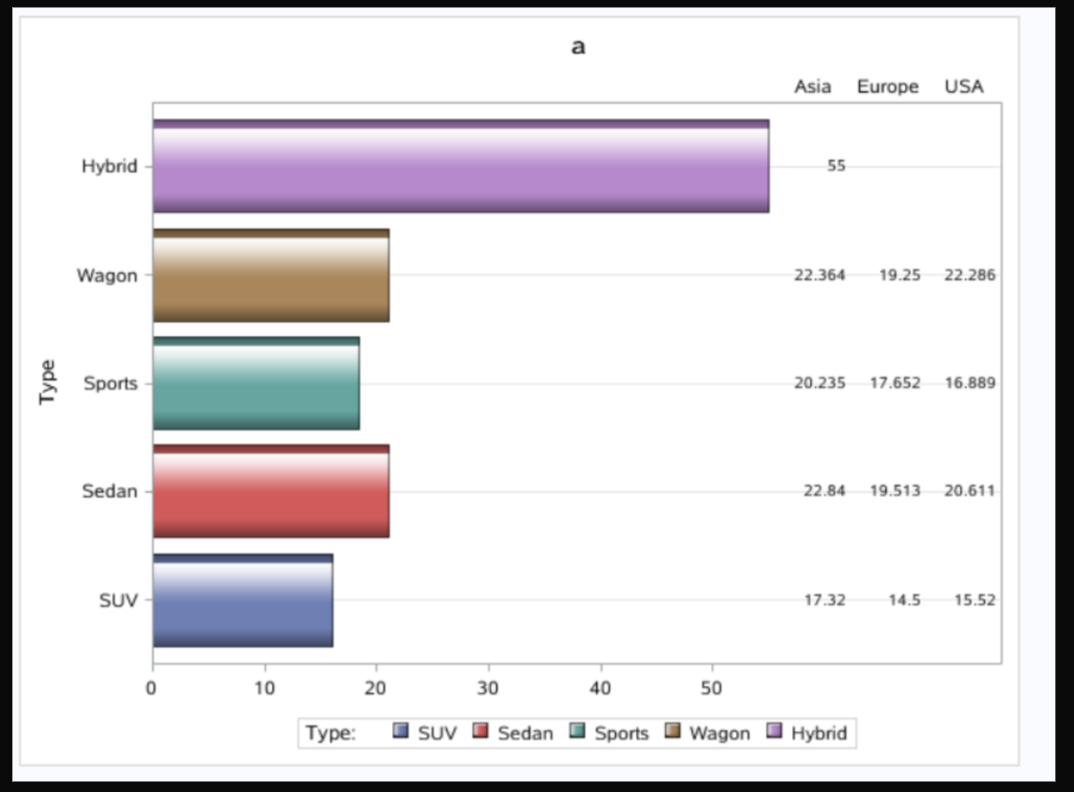
SAS figure中直接画统计量
innermargin 中stat只能求sum 或mean。
ods html;

proc template;
define statgraph _barchart;
begingraph / ;
    entrytitle "a";
    layout overlay / xaxisopts = (display = (ticks tickvalues)) yaxisopts = (griddisplay = on);
        barchart category = type response = mpg_city / group = type stat = mean orient = horizontal
                         dataskin = gloss name = "a";
        discretelegend 'a' / title = "Type: ";

        innermargin / align = right;
            axistable y = type value = mpg_city / class = origin display = (label)
                                        labelposition = max stat = mean;
        endinnermargin;
    endlayout;
endgraph;
end;
run;

proc sgrender data = sashelp.cars(where = (type not in ("Hybird" "Truck"))) template = _barchart;
run;
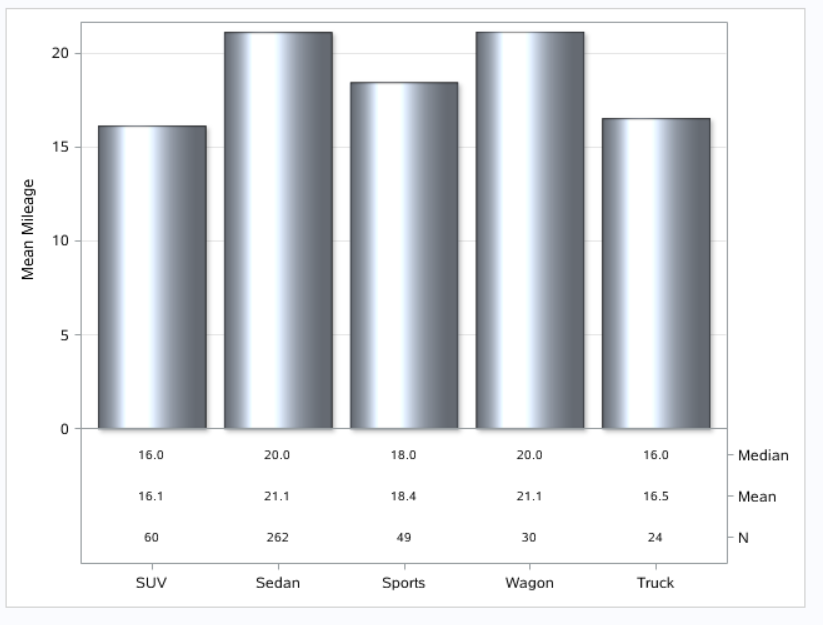
scatterplot中:
x 相当于barchart中category
y 是y2轴上的字符,这些变量需要提前指定在数据集中
markercharacter = var 数据集中提前算好的统计量的值
proc means data=sashelp.cars noprint;
  class type;
  var mpg_city;
  output out=CarsMeanMileage
         n=N
         mean=Mean
         median=Median;
run;

data GTL_GS_Cars;
  format mean median 4.1;
  set sashelp.cars CarsMeanMileage(where=(_type_ eq 1)
                                   rename=(type=TypeMean));
  if(typemean ne 'Hybrid');
  if(type ne 'Hybrid');
  NLabel='N'; meanLabel='Mean'; medianLabel='Median';
  run;
proc print data=GTL_GS_Cars;run;


ods html;

proc template;
define statgraph _barchart;
begingraph / subpixel = on;
    layout overlay / xaxisopts = (display = (ticks tickvalues)) yaxisopts = (griddisplay = on label = "Mean Mileage"
                            offsetmin = 0.25 labelposition = datacenter    )
                            y2axisopts = (offsetmin = 0.05 offsetmax = 0.8 display = (ticks tickvalues));
        barchart category = type response = mpg_city / stat = mean
                         dataskin = sheen ;

        scatterplot x = typemean y = Nlabel / markercharacter = n labelstrip = true yaxis = y2;
        scatterplot x = typemean y = meanlabel / markercharacter = mean labelstrip = true yaxis = y2;
        scatterplot x = typemean y = medianlabel / markercharacter = median labelstrip = true yaxis = y2;
    endlayout;
endgraph;
end;
run;

proc sgrender data = GTL_GS_Cars template = _barchart;
run;
本文来自博客园,作者:Iving,转载请注明原文链接:https://www.cnblogs.com/SAS-T/p/15374339.html
