
SAS datapanel
datapanel的轴label显示在水平方向正中间。
datalattice的轴的label显示在垂直方向正中间。
cellheightmin = num 指定行高度
columndatarange = union 根据columnvar中的值显示数据,不出现空的情况
columnweight = proportional|equal 按比例分配columnvar宽度
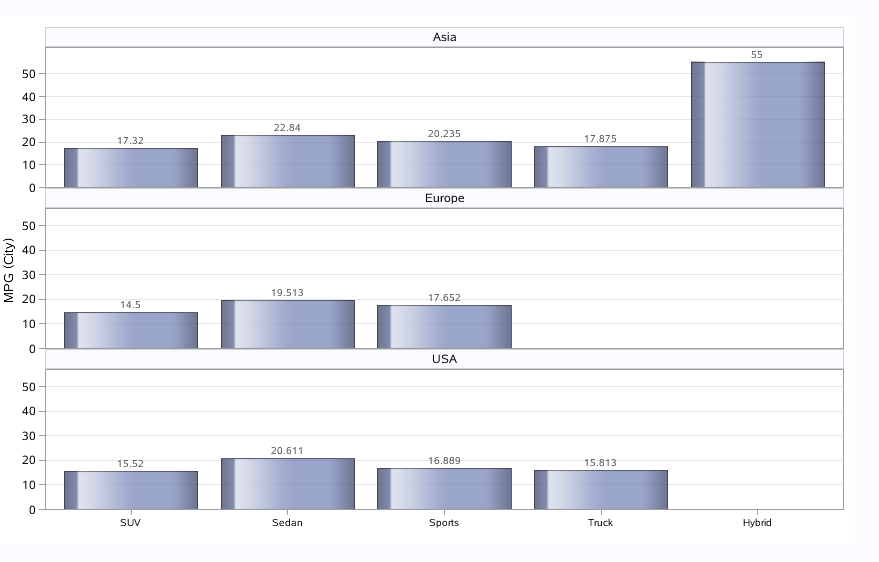
headerlabeldisplay = value 显示columnvar的值
barlabel = true 显示plot的值
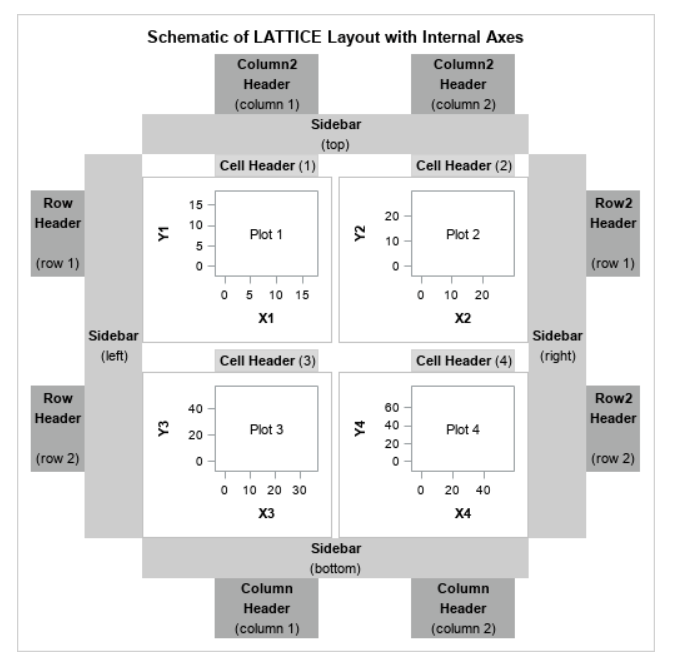
sidebar 是在datapanel外,一般用来显示legend。
可以使用INSET = (var1 var2)在cell中插入文本。SAS PROTOTYPE、SIDERBAR
ods html;

proc template;
define statgraph _datapanel;
    begingraph;
        layout datapanel classvars = (origin type) / columns = 3
                            rowaxisopts = ( griddisplay = on)
                            columnaxisopts = (griddisplay = on );
            layout prototype;
                scatterplot x = horsepower y = mpg_city / datatransparency = 0.7
                            markerattrs = (symbol = circlefilled size = 11);
            endlayout;
        endlayout;
    endgraph;
end;
run;

proc sgrender data = sashelp.cars(where = (type in ("Sedan" "Sports"))) template = _datapanel;
run;


proc template;
define statgraph _datapanel1;
    begingraph;
        layout datapane classvars = (origin) / headerlabeldisplay = value
                            rowaxisopts = ( griddisplay = on offsetmin = 0)
                            cellheightmin = 60
                            columnaxisopts = (display = (ticks tickvalues)
                                            linearopts = (tickvaluefitpolicy = thin)
                                            tickvalueattrs = (size = 7));
            layout prototype / cycleattrs = true;
                barchart x = type y = mpg_city / stat = mean dataskin = gloss datatransparency = 0.3
                                                barlabel = true;
            endlayout;
        endlayout;
    endgraph;
end;
run;

proc sgrender data = sashelp.cars(where = (type not in ("Hybird" "Wagon"))) template = _datapanel1;
run;

proc template;
define statgraph _datapanel2;
    begingraph;
        layout datapane classvars = (origin) / headerlabeldisplay = value columns = 3
                            rowaxisopts = ( griddisplay = on offsetmin = 0)
                            columnaxisopts = (display = (ticks tickvalues)
                                            linearopts = (tickvaluefitpolicy = thin)
                                            tickvalueattrs = (size = 7));
            layout prototype / cycleattrs = true;
                barchart x = type y = mpg_city / stat = mean dataskin = gloss datatransparency = 0.3
                                                barlabel = true;
            endlayout;
        endlayout;
    endgraph;
end;
run;

proc sgrender data = sashelp.cars(where = (type not in ("Hybird" "Wagon"))) template = _datapanel2;
run;


proc template;
define statgraph _datapanel3;
    begingraph;
        layout datapane classvars = (origin) / headerlabeldisplay = value columns = 3 columndatarange = union
                            rowaxisopts = ( griddisplay = on offsetmin = 0)
                            columnaxisopts = (display = (ticks tickvalues)
                                            linearopts = (tickvaluefitpolicy = thin)
                                            tickvalueattrs = (size = 7));
            layout prototype / cycleattrs = true;
                barchart x = type y = mpg_city / stat = mean dataskin = gloss datatransparency = 0.3
                                                barlabel = true;
            endlayout;
        endlayout;
    endgraph;
end;
run;

proc sgrender data = sashelp.cars(where = (type not in ("Hybird" "Wagon"))) template = _datapanel3;
run;


proc template;
define statgraph _datapanel4;
    begingraph;
        layout datapanel classvars = (origin) / headerlabeldisplay = value columns = 3
                            columndatarange = union    columnweight = proportional
                            rowaxisopts = ( griddisplay = on offsetmin = 0)
                            columnaxisopts = (display = (ticks tickvalues)
                                            linearopts = (tickvaluefitpolicy = thin)
                                            tickvalueattrs = (size = 7));
            layout prototype / cycleattrs = true;
                barchart x = type y = mpg_city / stat = mean dataskin = gloss datatransparency = 0.3
                                                barlabel = true;
            endlayout;
        endlayout;
    endgraph;
end;
run;

proc sgrender data = sashelp.cars(where = (type not in ("Hybird" "Wagon"))) template = _datapanel4;
run;


proc template;
define statgraph _datapanel5;
    begingraph;
        layout datapanel classvars = (origin) / headerlabeldisplay = value columns = 2
                            rowaxisopts = ( griddisplay = on offsetmin = 0)
                            columnaxisopts = (display = (ticks tickvalues)
                                            linearopts = (tickvaluefitpolicy = thin)
                                            tickvalueattrs = (size = 7));
            layout prototype / cycleattrs = true;
                barchart x = type y = mpg_city / stat = mean dataskin = gloss datatransparency = 0.3
                                                barlabel = true name = "c" legendlabel = "City";
                barchart x = type y = mpg_highway / stat = mean dataskin = gloss datatransparency = 0.3
                                                    barwidth = 0.5
                                                barlabel = true name = "d" legendlabel = "Highway";
            endlayout;
                sidebar / spacefill = false;
                    discretelegend "c" "d";
                endsidebar;
        endlayout;
    endgraph;
end;
run;

proc sgrender data = sashelp.cars(where = (type not in ("Hybird" "Truck" "Wagon"))) template = _datapanel5;
run;


data GTL_GS_Labs2;
  pi=constant('PI');
  do Lab='Lab-1', 'Lab-2', 'Lab-3', 'Lab-4', 'Lab-5', 'Lab-6';
    amp=100*ranuni(4);
    phase=2*pi*ranuni(3);
    do day=1 to 300 by 5;
      Value=amp*(1+0.1*(sin(day*pi/180+phase)+0.2*ranuni(5)));
      output;
    end;
  end;
run;


proc template;
define statgraph _datapanel6;
    begingraph;
        layout datapanel classvars = (lab) / headerlabeldisplay = value
                            rows = 2 columns = 3 columndatarange = union rowgutter = 5
                            rowaxisopts = ( griddisplay = on offsetmin = 0)
                            columnaxisopts = (display = (ticks tickvalues)
                                            linearopts = (tickvaluefitpolicy = thin)
                                            tickvalueattrs = (size = 7));
            layout prototype / cycleattrs = true;
                seriesplot x = day y = value / lineattrs = graphdata2(thickness = 2 pattern = solid);
            endlayout;
        endlayout;
    endgraph;
end;
run;

proc sgrender data = GTL_GS_Labs2 template = _datapanel6;
run;
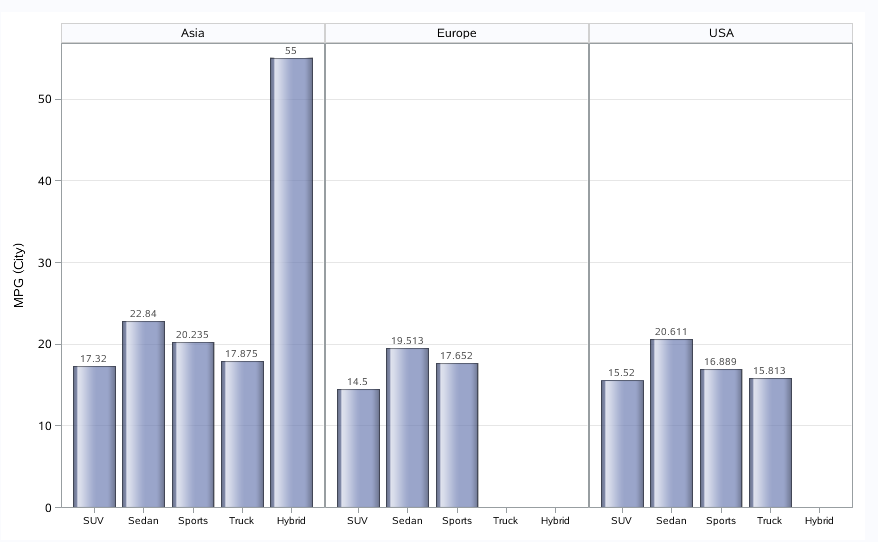
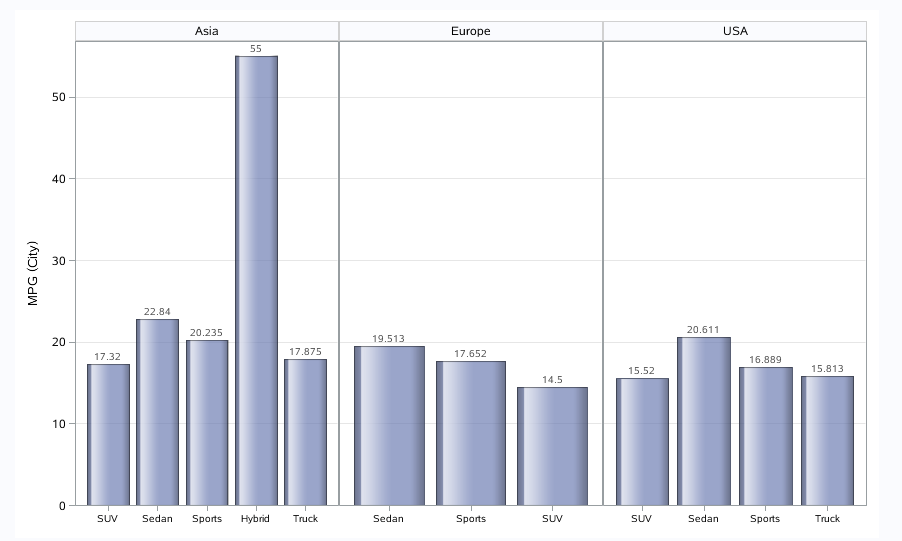
这个图加了columndatarange = union
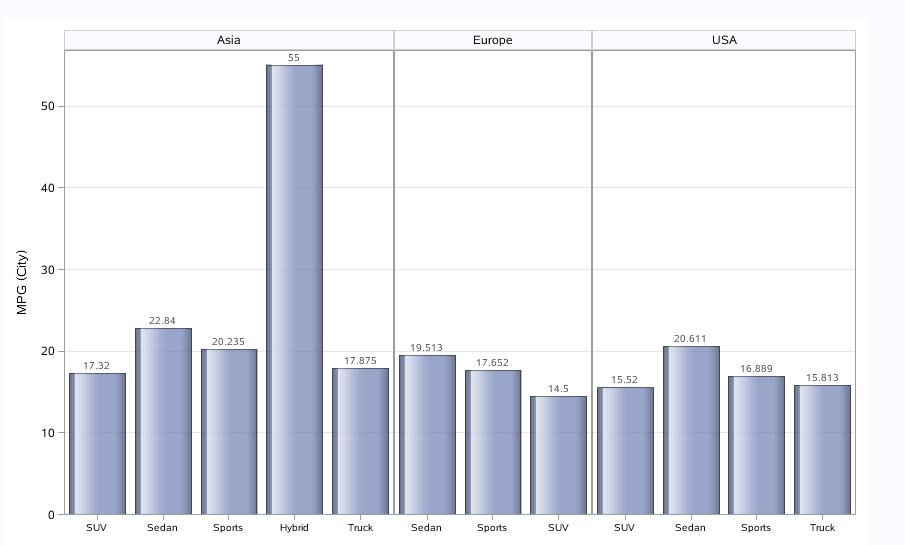
这个图加了columnweight = proportional
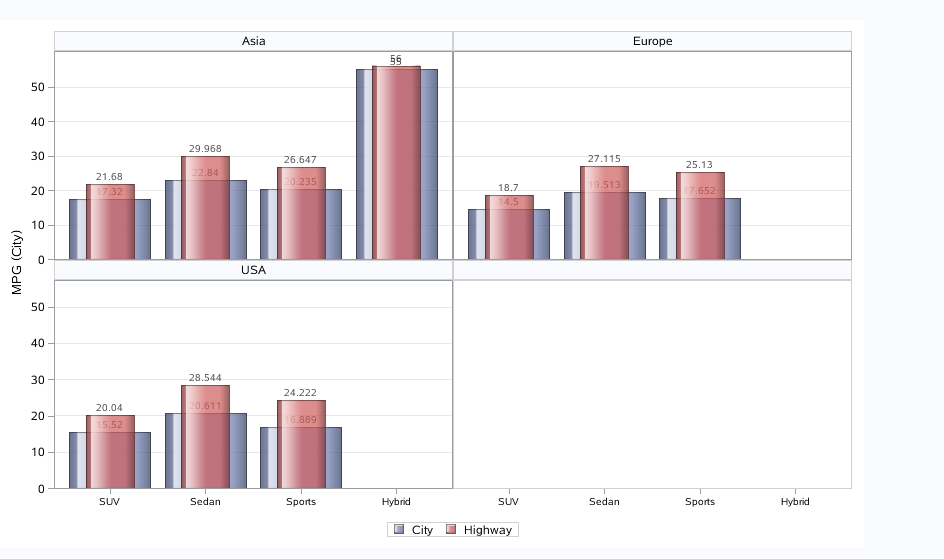
classvars = (origin) / headerlabeldisplay = value columns = 2。是这两个选项起作用。
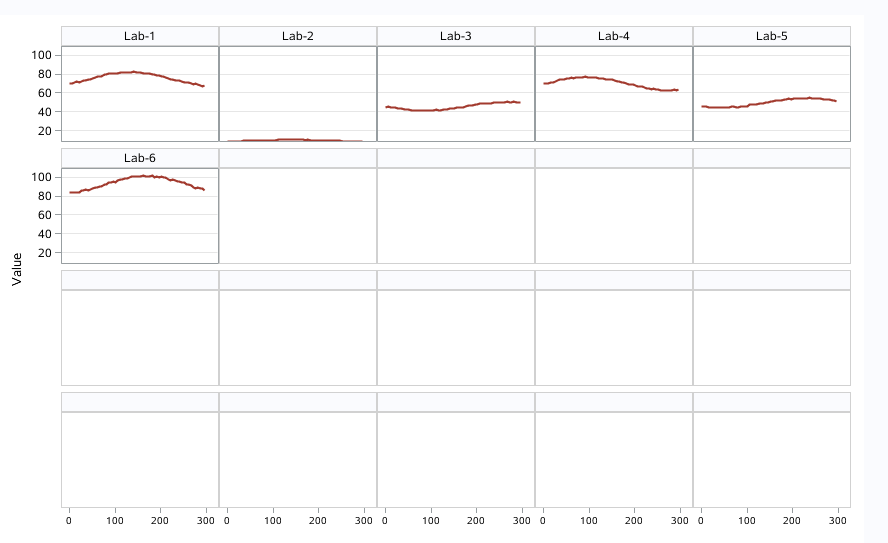
layout datapanell classvars = (lab) / rows = 4 columns = 5 columndatarange = union rowgutter = 5
本文来自博客园,作者:Iving,转载请注明原文链接:https://www.cnblogs.com/SAS-T/p/15370969.html

