SAS datalattice row
rows = num 相当于用几个block来显示所有plots
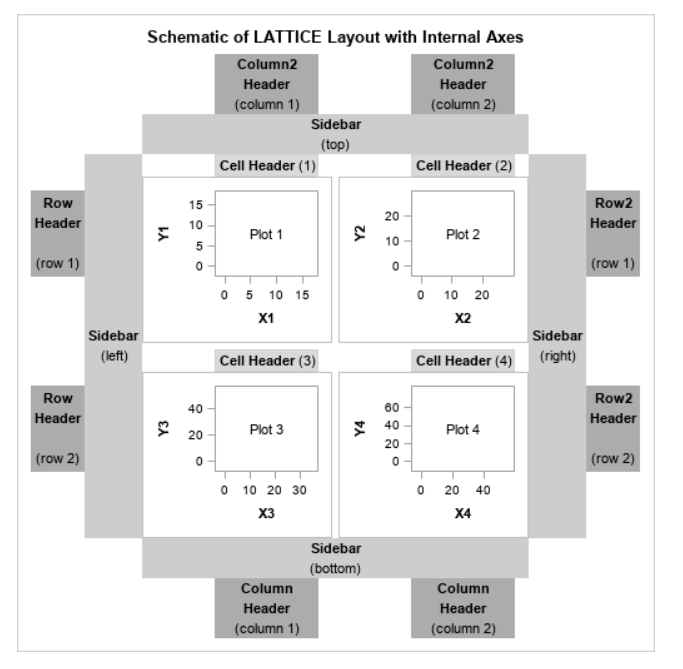
可以使用INSET = (var1 var2)在cell中插入文本。SAS PROTOTYPE、SIDERBAR
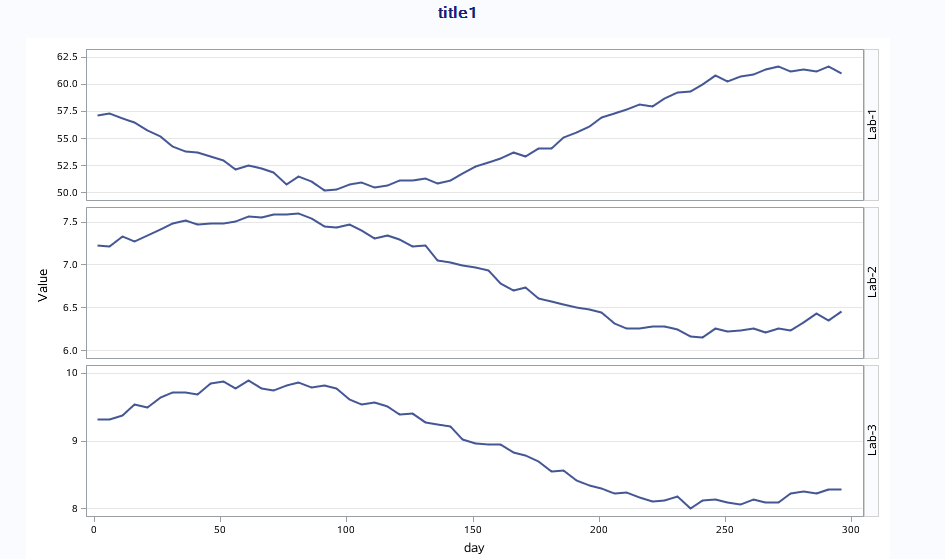
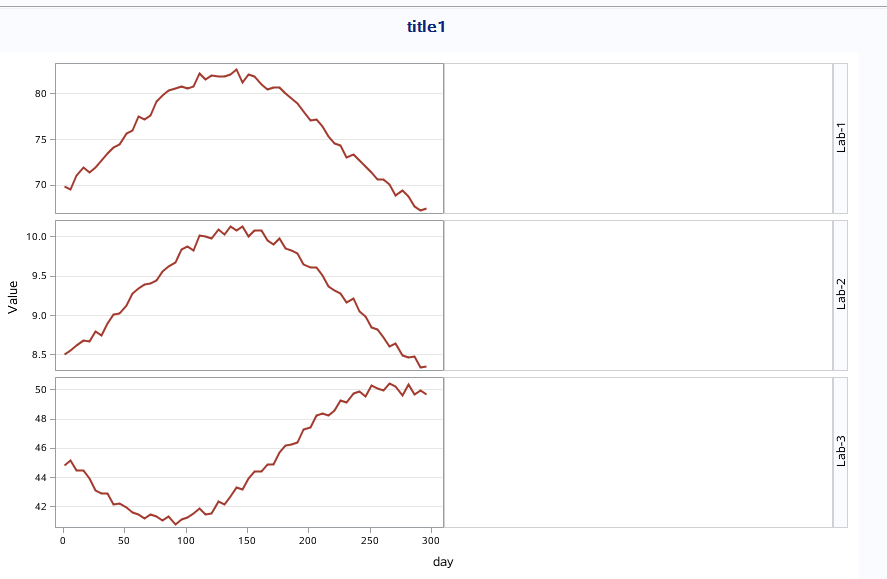
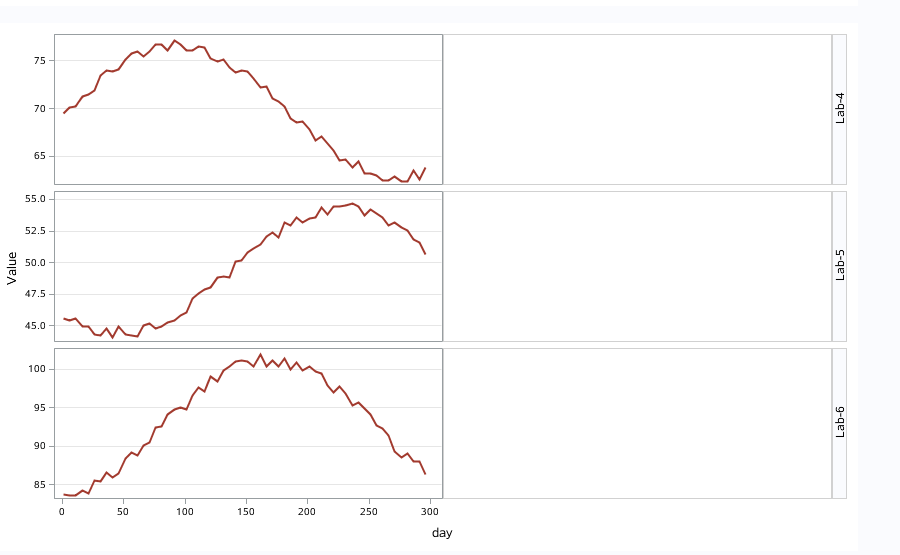
data GTL_GS_Labs;
  pi=constant('PI');
  do Lab='Lab-1', 'Lab-2', 'Lab-3';
    amp=100*ranuni(3);
    phase=pi*ranuni(2);
    do day=1 to 300 by 5;
      Value=amp*(1+0.1*(sin(day*pi/180+phase)+0.2*ranuni(2)));
      output;
    end;
  end;
run;

ods html;

proc template;
define statgraph _datalattice;
    begingraph;
        layout datalattice rowvar = lab / rowdatarange = union headerlabeldisplay = value rowgutter = 5
                            rowaxisopts = ( griddisplay = on label = "Value" tickvalueattrs = (size = 7)) columngutter = 0.2
                            columnaxisopts = ( tickvalueattrs = (size = 7));
            layout prototype / cycleattrs = true;
                seriesplot x = day y = value / lineattrs = (thickness = 2);
            endlayout;
        endlayout;
    endgraph;
end;
run;

proc sgrender data = GTL_GS_Labs template = _datalattice;
run;


data GTL_GS_Labs2;
  pi=constant('PI');
  do Lab='Lab-1', 'Lab-2', 'Lab-3', 'Lab-4', 'Lab-5', 'Lab-6';
    amp=100*ranuni(4);
    phase=2*pi*ranuni(3);
    do day=1 to 300 by 5;
      Value=amp*(1+0.1*(sin(day*pi/180+phase)+0.2*ranuni(5)));
      output;
    end;
  end;
run;

proc template;
define statgraph _datalattice1;
    begingraph;
        layout datalattice rowvar = lab / rows = 3 columns = 2 rowdatarange = union headerlabeldisplay = value rowgutter = 5
                            rowaxisopts = ( griddisplay = on label = "Value" tickvalueattrs = (size = 7))
                            columnaxisopts = ( tickvalueattrs = (size = 7));
            layout prototype / cycleattrs = true;
                seriesplot x = day y = value / lineattrs = graphdata2(thickness = 2 pattern = solid);
            endlayout;
        endlayout;
    endgraph;
end;
run;

proc sgrender data = GTL_GS_Labs2 template = _datalattice1;
run;
本文来自博客园,作者:Iving,转载请注明原文链接:https://www.cnblogs.com/SAS-T/p/15370876.html