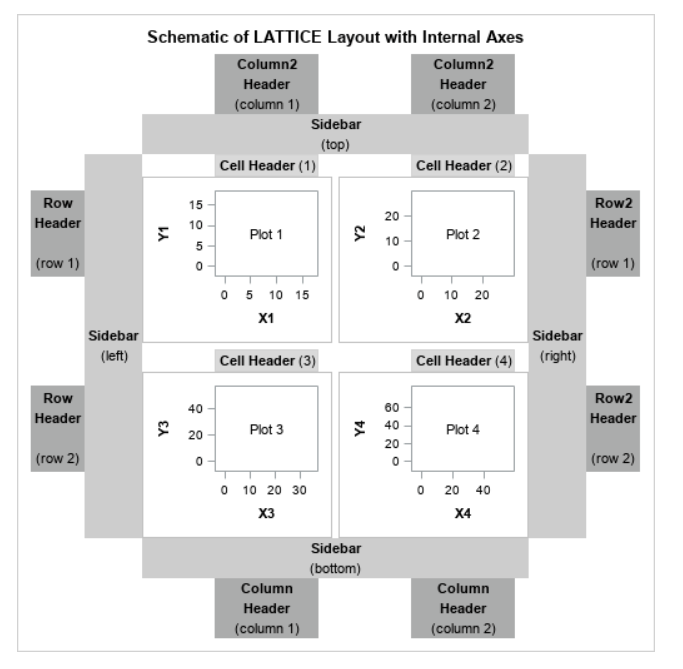
SAS datalattice column
columndatarange = union 根据columnvar中的值显示数据,不出现空的情况
columnweight = proportional|equal 按比例分配columnvar宽度
headerlabeldisplay = value 显示columnvar的值
barlabel = true 显示plot的值
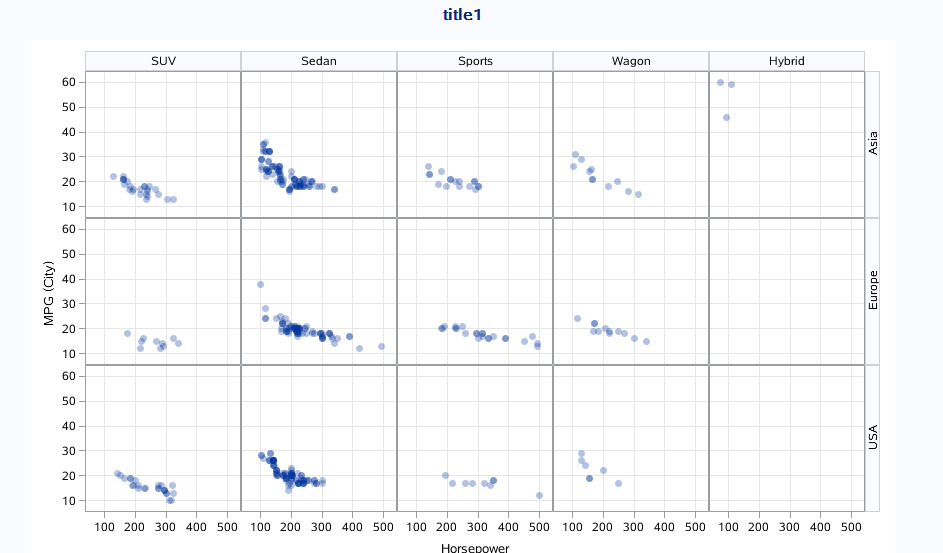
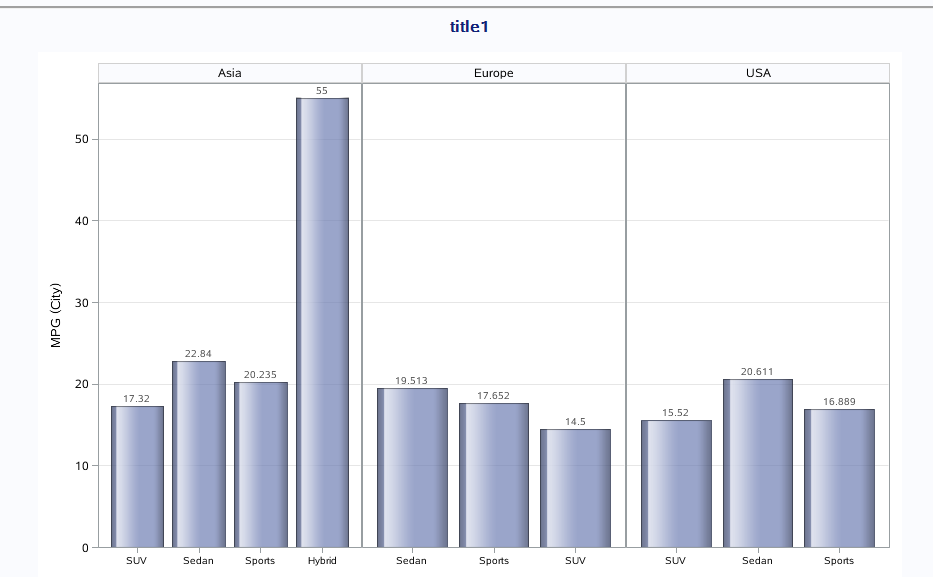
ods html;

proc template;
define statgraph _datalattice;
    begingraph;
        layout datalattice rowvar = origin columnvar = type / columndatarange = auto rowdatarange = auto
                            headerlabeldisplay = value
                            rowaxisopts = ( griddisplay = on linearopts = (tickvaluefitpolicy = thin))
                            columnaxisopts = (griddisplay = on );
            layout prototype;
                scatterplot x = horsepower y = mpg_city / datatransparency = 0.7
                            markerattrs = (symbol = circlefilled size = 11);
            endlayout;
        endlayout;
    endgraph;
end;
run;

proc sgrender data = sashelp.cars(where = (type not in ("Hybird" "Truck"))) template = _datalattice;
run;


proc template;
define statgraph _datalattice1;
    begingraph;
        layout datalattice columnvar = origin / columndatarange = UNION
                            headerlabeldisplay = value
                            rowaxisopts = ( griddisplay = on offsetmin = 0)
                            columnaxisopts = (display = (ticks tickvalues)
                                            linearopts = (tickvaluefitpolicy = thin)
                                            tickvalueattrs = (size = 7));
            layout prototype / cycleattrs = true;
                barchart x = type y = mpg_city / stat = mean dataskin = gloss datatransparency = 0.3
                                                barlabel = true;
            endlayout;
        endlayout;
    endgraph;
end;
run;

proc sgrender data = sashelp.cars(where = (type not in ("Hybird" "Truck" "Wagon"))) template = _datalattice1;
run;


proc template;
define statgraph _datalattice2;
    begingraph;
        layout datalattice columnvar = origin / columndatarange = UNION
                            columnweight = proportional
                            headerlabeldisplay = value
                            rowaxisopts = ( griddisplay = on offsetmin = 0)
                            columnaxisopts = (display = (ticks tickvalues)
                                            linearopts = (tickvaluefitpolicy = thin)
                                            tickvalueattrs = (size = 7));
            layout prototype / cycleattrs = true;
                barchart x = type y = mpg_city / stat = mean dataskin = gloss datatransparency = 0.3
                                                barlabel = true dataskin = gloss;
            endlayout;
        endlayout;
    endgraph;
end;
run;

proc sgrender data = sashelp.cars(where = (type not in ("Hybird" "Truck" "Wagon"))) template = _datalattice2;
run;


proc template;
define statgraph _datalattice3;
    begingraph;
        layout datalattice columnvar = origin / columndatarange = UNION
                            columnweight = proportional
                            headerlabeldisplay = value
                            rowaxisopts = ( griddisplay = on offsetmin = 0)
                            columnaxisopts = (display = (ticks tickvalues)
                                            linearopts = (tickvaluefitpolicy = thin)
                                            tickvalueattrs = (size = 7));
            layout prototype / cycleattrs = true;
                barchart x = type y = mpg_city / stat = mean dataskin = gloss datatransparency = 0.3
                                                /*barlabel = true*/ dataskin = gloss name = "c" legendlabel = "City";
                barchart x = type y = mpg_highway / stat = mean dataskin = gloss datatransparency = 0.3
                                                barwidth = 0.5
                                                /*barlabel = true*/ dataskin = gloss name = "h" legendlabel = "Highway";

            endlayout;
        endlayout;
    endgraph;
end;
run;

proc sgrender data = sashelp.cars(where = (type not in ("Hybird" "Truck" "Wagon"))) template = _datalattice3;
run;
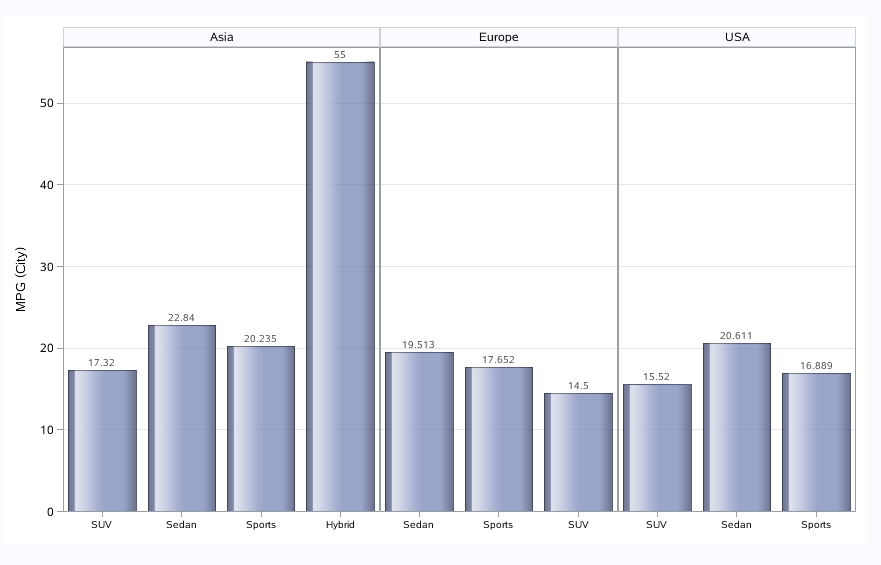
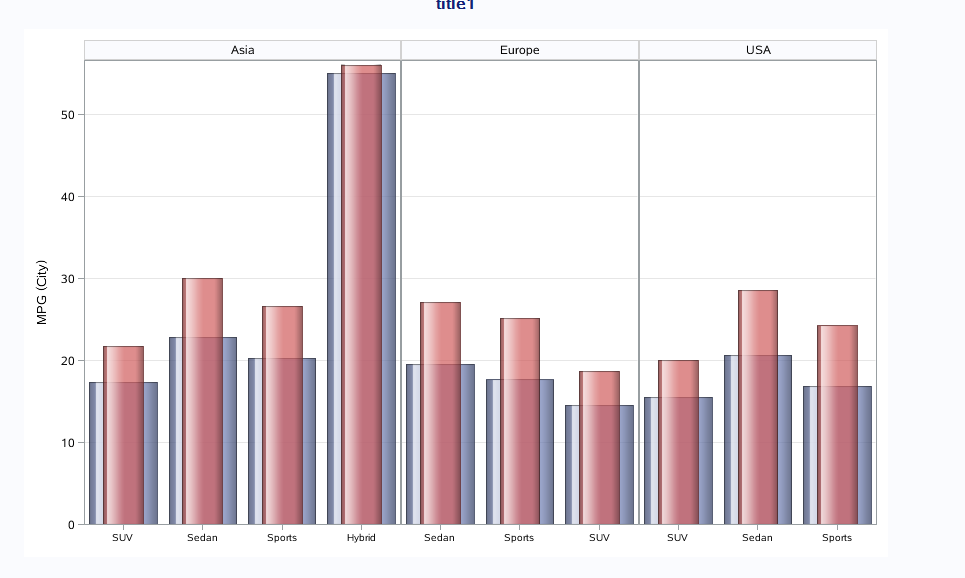
第三个图是加了 columnweight = proportional 使得每个柱子宽度相同。
本文来自博客园,作者:Iving,转载请注明原文链接:https://www.cnblogs.com/SAS-T/p/15370814.html

 浙公网安备 33010602011771号