SAS barchart Innermargin
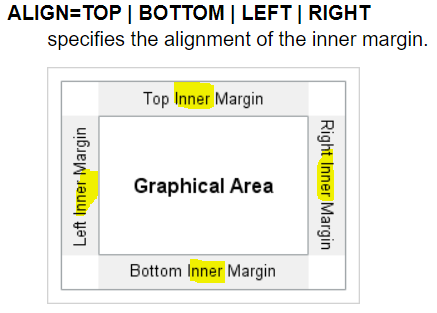
innermargin是用在layout overlay或prototype中,去定义一个block plot or axis table。
prototype是用在DATALATTICE|DATAPANEL中定义一个plot structure.

/* Create a format for the quarters */
proc format;
   value quartername 1="Quarter 1" 2="Quarter 2"
      3="Quarter 3" 4="Quarter 4";
run;

/* Define the graph template */
proc template;
   define statgraph innermargin;
      dynamic year;
      begingraph / subpixel=on;
         entrytitle "Total Sales in " year;
         layout overlay /
            xaxisopts=(type=discrete discreteopts=(ticktype=inbetween));
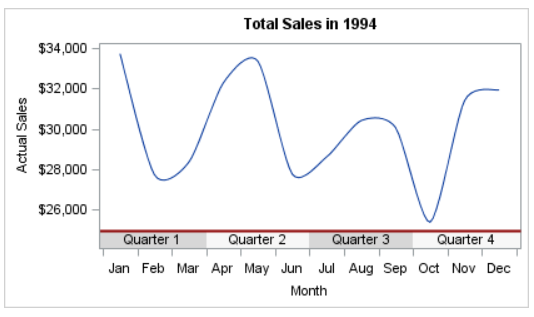
            innermargin /
               separator=true
               separatorattrs=(color=darkred thickness=2px);
               blockplot x=month block=quarter /
                  filltype=alternate
                  fillattrs=(color=cxd7d7d7)
                  altfillattrs=(color=cxf7f7f7)
                  display=(fill values) valuehalign=center;
            endinnermargin;
            linechart category=month response=actual /
               smoothconnect=true;
          endlayout;
       endgraph;
    end;
run;

/* Generate the graph */
proc sgrender data=sashelp.prdsale template=innermargin;
   format quarter quartername.;
   where year=1994;
   dynamic year=1994;
run;
ods html;

proc template;
define statgraph _barchart;
begingraph / ;
    entrytitle "a";
    layout overlay / xaxisopts = (display = (ticks tickvalues)) yaxisopts = (griddisplay = on);
        barchart category = type response = mpg_city / group = type stat = mean orient = horizontal
                         dataskin = gloss name = "a";
        discretelegend 'a' / title = "Type: ";

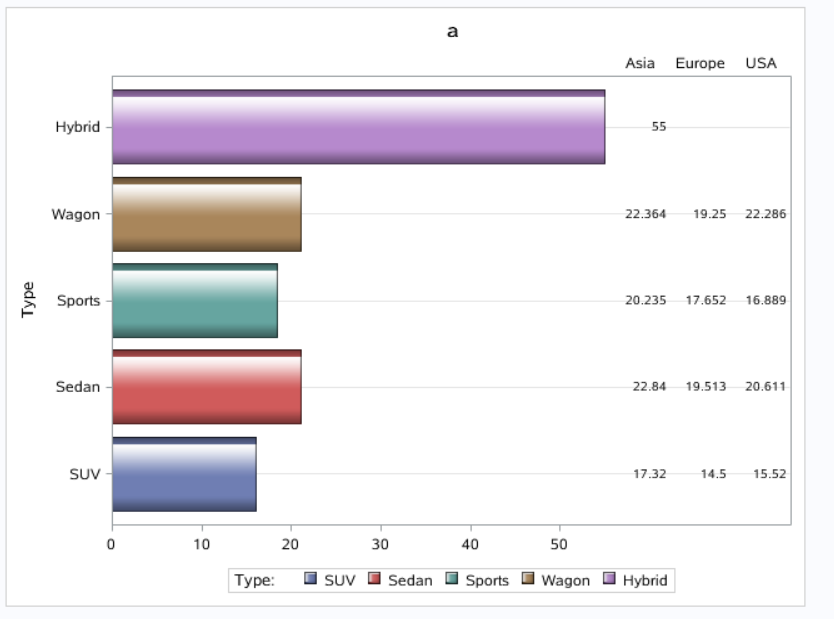
        innermargin / align = right;
            axistable y = type value = mpg_city / class = origin display = (label)
                                        labelposition = max stat = mean;
        endinnermargin;
    endlayout;
endgraph;
end;
run;

proc sgrender data = sashelp.cars(where = (type not in ("Hybird" "Truck"))) template = _barchart;
run;


本文来自博客园,作者:Iving,转载请注明原文链接:https://www.cnblogs.com/SAS-T/p/15368600.html


