SAS stepplot
BREAK = TRUE|FALSE 数据中有缺失值时,是显示一条水平线还是空白
JUSTIFY= 数据点直接的连接方式。多使用center。
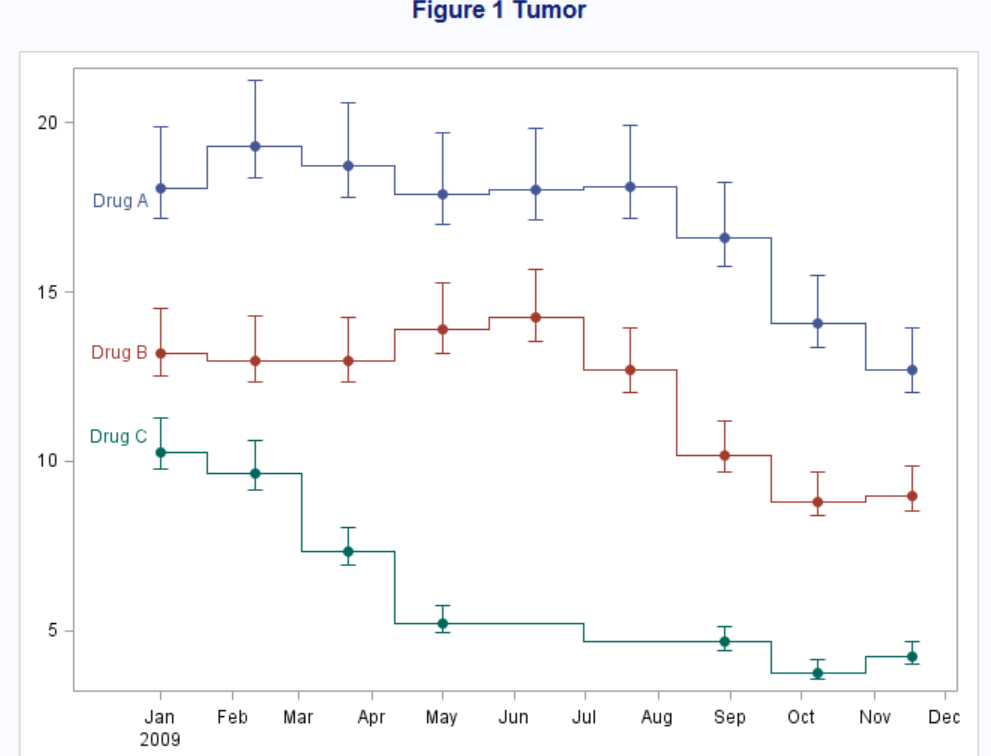
data GTL_GS_stepGroup;
format Date Date9.;
do i=0 to 334 by 40;
date='01jan2009'd+i;
if mod (i, 30) =0 then freq=1; else freq=0;
Drug='Drug A'; Val = 16+ 3*sin(i/90+0.5) + 1*sin(3*i/90+0.7);
upper=val*1.1; lower=val*0.95; output;
Drug='Drug B'; Val = 11+ 3*sin(i/90+0.5) + 1*cos(3*i/90+0.7);
upper=val*1.1; lower=val*0.95; output;

if i > 150 and i < 210 then val=.;
else Val = 7+ 3*cos(i/90+0.5) + 1*sin(3*i/90+0.7);

Drug='Drug C'; upper=val*1.1; lower=val*0.95; output;
end;
run;

ods html;
*
BREAK: TRUE/FALSE: gap in the curve
MARKERATTRS = ()
LINEATTRS = ()
CURVELABELPOSITON= START END MIN MAX AUTO

;
proc template;
define statgraph _stepplot;
begingraph;
    layout overlay / xaxisopts = (display = (ticks tickvalues line)) yaxisopts = ( display = (ticks tickvalues line));
        stepplot x = date y = val / group = drug errorupper = upper errorlower = lower
                                    lineattrs = (pattern = solid) justify = center
                                    display = (markers)    markerattrs = (symbol = circlefilled) break = false
                                    curvelabel = drug curvelabelposition = start;
    endlayout;
endgraph;
end;
run;

proc sgrender data = GTL_GS_stepGroup template = _stepplot;
run;

ods _all_ close;
本文来自博客园,作者:Iving,转载请注明原文链接:https://www.cnblogs.com/SAS-T/p/15368495.html

 浙公网安备 33010602011771号