Python——饼图
matplotlib.pyplot.pie(
        x, explode=None, labels=None, colors=None, autopct=None,
        pctdistance=0.6, shadow=False, labeldistance=1.1,
        startangle=None, radius=None, counterclock=True,
        wedgeprops=None, textprops=None, center=(0, 0), frame=False,
        rotatelabels=False, *, data=None)
pie()函数的常用函数
| 参数名称 | 含义 |
|---|---|
| x | 传入的数据 |
| explode | 默认x的饼图不爆炸。自定义确定哪一块爆炸&爆炸距离。 |
| labels和labeldistance | 默认x没有标签,标签位于1.1倍半径处。自定义每块饼的标签,和位置。 |
| autopct和pctdistance | 默认x不显示每块饼的百分比标注。autopct自定义是每块饼的百分比属性,如几位小数, pctdistance默认在半径0.6位置显示百分数,自定义百分数距离半径的比例。 |
| shadow | 默认x是二维平面饼图,没有阴影。自定义饼图是否有阴影属性。 |
| startangle | 默认x第一块饼和水平面的角度不固定。自定义第一块饼图和水平面的角度。 |
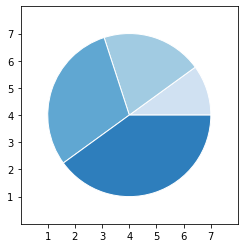
1 示例
import matplotlib.pyplot as plt
import numpy as np

x = [1, 2, 3, 4]
colors = plt.get_cmap('Blues')(np.linspace(0.2, 0.7, len(x)))

fig, ax = plt.subplots()
ax.pie(x, colors=colors, radius=3, center=(4, 4),
       wedgeprops={"linewidth": 1, "edgecolor": "white"}, frame=True)

ax.set(xlim=(0, 8), xticks=np.arange(1, 8),
       ylim=(0, 8), yticks=np.arange(1, 8))

plt.show()
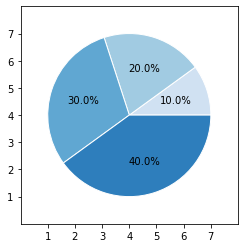
2 添加标签数值
import matplotlib.pyplot as plt
import numpy as np

x = [1, 2, 3, 4]
colors = plt.get_cmap('Blues')(np.linspace(0.2, 0.7, len(x)))

fig, ax = plt.subplots()
ax.pie(x, colors=colors, radius=3, center=(4, 4),
       wedgeprops={"linewidth": 1, "edgecolor": "white"}, autopct='%.1f%%', frame=True)

ax.set(xlim=(0, 8), xticks=np.arange(1, 8),
       ylim=(0, 8), yticks=np.arange(1, 8))

plt.show()
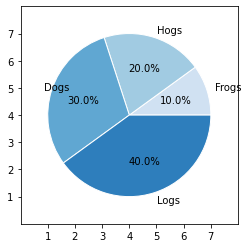
3 添加标签和数值
import matplotlib.pyplot as plt
import numpy as np

x = [1, 2, 3, 4]
labels = ['Frogs', 'Hogs', 'Dogs', 'Logs']
colors = plt.get_cmap('Blues')(np.linspace(0.2, 0.7, len(x)))

fig, ax = plt.subplots()
ax.pie(x, colors=colors, radius=3, center=(4, 4),labels=labels,
       wedgeprops={"linewidth": 1, "edgecolor": "white"}, autopct='%.1f%%', frame=True)

ax.set(xlim=(0, 8), xticks=np.arange(1, 8),
       ylim=(0, 8), yticks=np.arange(1, 8))

plt.show()
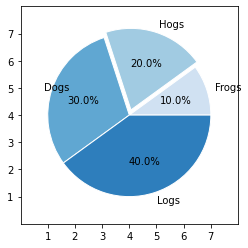
4 爆炸某块饼(爆炸距离是半径的0.2)
import matplotlib.pyplot as plt
import numpy as np

x = [1, 2, 3, 4]
labels = ['Frogs', 'Hogs', 'Dogs', 'Logs']
colors = plt.get_cmap('Blues')(np.linspace(0.2, 0.7, len(x)))
explode = (0, 0.2, 0, 0) # 只爆炸Hogs,爆炸距离是半径的0.2。

fig, ax = plt.subplots()
ax.pie(x, colors=colors,explode=explode, radius=3, center=(4, 4),labels=labels,
       wedgeprops={"linewidth": 1, "edgecolor": "white"}, autopct='%.1f%%', frame=True)

ax.set(xlim=(0, 8), xticks=np.arange(1, 8),
       ylim=(0, 8), yticks=np.arange(1, 8))

plt.show()
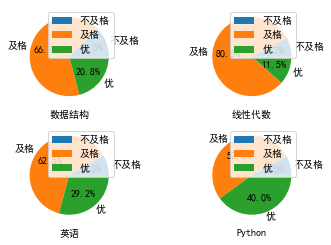
5 循环饼图
from itertools import groupby
import matplotlib.pyplot as plt
#设置图形中使用中文字体
plt.rcParams['font.sans-serif']=['simhei']
#每门课程的成绩
scores={'数据结构':[89,70,49,87,92,84,73,71,78,81,90,37,
                77,82.81,79,80,82,75,90,54,80,70,68,61],
        '线性代数':[70,74,80,60,50,87,68,77,95,80,79,74,
                69,64,82,81,78,90,78,79,72,69,45,70,70,79],
        '英语':[83,87,69,55,80,89,96,81,83,90,5470,79,
              66,85,82,88,76,60,80,75,83,75,70,20],
        'Python':[90,60,82,79,88,92,85,87,89,71,45,50,
                  80,81,87,93,80,70,68,65,85,89,80,72,75]}
#自定义分组函数,在下面的groupby()函数中使用
def splitscore(score):
    if score>=85:
        return '优'
    elif score>=60:
        return '及格'
    else:
        return '不及格'
#统计每门课程中优、及格、不及格的人数
ratios=dict()
for subject,subjectScore in scores.items():
    ratios[subject]={}
    #groupby()函数需要对原始分数进行排序才能正确分类
    for category,num in groupby(sorted(subjectScore),splitscore):
        ratios[subject][category]=len(tuple(num))

#创建4个子图
fig,axs=plt.subplots(2,2)
axs.shape=4,
#依次在4个子图中绘制每门课程的饼状图
for index, subjectData in enumerate(ratios.items()):
    #选择子图
    plt.sca(axs[index])
    subjectName, subjectRatio = subjectData #每个扇形对应的数值
    plt.pie(list(subjectRatio.values()),
            labels=list(subjectRatio.keys()),#每个扇形的标签
            autopct='%1.1f%%')  #百分比显示格式
    plt.xlabel(subjectName)
    plt.legend()
    plt.gca().set_aspect('equal') #设置纵横比相等
plt.show()

 浙公网安备 33010602011771号