OpenCV入门:(六:基础画图函数)
有时程序中需要画一些基础的图形,例如直线,矩形,椭圆以及多边形。OpenCV中当然有此类函数。
1.函数介绍
直线line:
void line(Mat& img, Point pt1, Point pt2, const Scalar& color, int thickness=1, int lineType=8, int shift=0)
img – 图像
pt1 – 直线起点
pt2 – 直线终点
color – 颜色
thickness – 粗细
lineType – 直线类型,可以是如下值
8 (or omitted) - 8-connected 线
4 - 4-connected 线.
CV_AA - 抗锯齿线.
shift – 分位的点坐标
椭圆ellipse:
void ellipse(Mat& img, Point center, Size axes, double angle, double startAngle, double endAngle, const Scalar& color, int thickness=1, int lineType=8, int shift=0)
void ellipse(Mat& img, const RotatedRect& box, const Scalar& color, int thickness=1, int lineType=8)
参数说明:
img – 图像
center – 椭圆中心
axes – 椭圆主半轴长度
angle –旋转角度
startAngle – 椭圆弧起始角度
endAngle – 椭圆弧终止角度
box – Alternative ellipse representation via RotatedRect or CvBox2D. This means that the function draws an ellipse inscribed in the rotated rectangle.
color – 颜色
thickness –  粗细,如果小于0,表示填充椭圆
lineType – 和line函数一样,直线类型
shift – 部分点位坐标
矩形rectangle:
void rectangle(Mat& img, Point pt1, Point pt2, const Scalar& color, int thickness=1, int lineType=8, int shift=0)
void rectangle(Mat& img, Rect rec, const Scalar& color, int thickness=1, int lineType=8, int shift=0 )
参数说明:
img – 图像
pt1 – 顶点坐标
pt2 – 与p1相对的顶点坐标
rec – 矩形的选择规范
color – 矩形的颜色或亮度
thickness – 和椭圆函数一样
lineType – 和line函数一样
shift – 部分点位坐标
圆circle:
void circle(Mat& img, Point center, int radius, const Scalar& color, int thickness=1, int lineType=8, int shift=0) 参数说明: img – Image where the circle is drawn. center – Center of the circle. radius – Radius of the circle. color – Circle color. thickness – Thickness of the circle outline, if positive. Negative thickness means that a filled circle is to be drawn. lineType – Type of the circle boundary. See the line() description. shift – Number of fractional bits in the coordinates of the center and in the radius value.多边形fillPoly:
void fillPoly(Mat& img, const Point** pts, const int* npts, int ncontours, const Scalar& color, int lineType=8, int shift=0, Point offset=Point() )
参数说明:
img – Image.
pts – Array of polygons where each polygon is represented as an array of points.
npts – Array of polygon vertex counters.
ncontours – Number of contours that bind the filled region.
color – Polygon color.
lineType – Type of the polygon boundaries. See the line() description.
shift – Number of fractional bits in the vertex coordinates.
offset – Optional offset of all points of the contours.
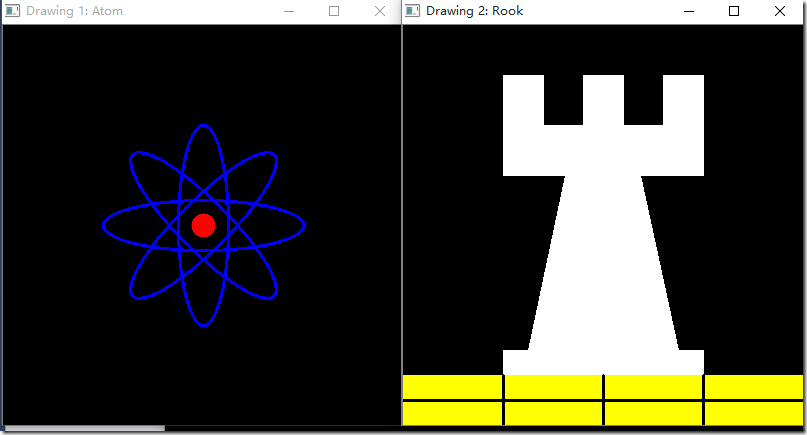
2.代码
#define w 400

/// 函数定义
void MyEllipse( Mat img, double angle );
void MyFilledCircle( Mat img, Point center );
void MyPolygon( Mat img );
void MyLine( Mat img, Point start, Point end );


int BasicDraw( void ){

  char atom_window[] = "Drawing 1: Atom";
  char rook_window[] = "Drawing 2: Rook";

  Mat atom_image = Mat::zeros( w, w, CV_8UC3 );
  Mat rook_image = Mat::zeros( w, w, CV_8UC3 );

  MyEllipse( atom_image, 90 );
  MyEllipse( atom_image, 0 );
  MyEllipse( atom_image, 45 );
  MyEllipse( atom_image, -45 );

  MyFilledCircle( atom_image, Point( w/2, w/2) );

  MyPolygon( rook_image );

  rectangle( rook_image,
         Point( 0, 7*w/8 ),
         Point( w, w),
         Scalar( 0, 255, 255 ),
         -1,
         8 );

  MyLine( rook_image, Point( 0, 15*w/16 ), Point( w, 15*w/16 ) );
  MyLine( rook_image, Point( w/4, 7*w/8 ), Point( w/4, w ) );
  MyLine( rook_image, Point( w/2, 7*w/8 ), Point( w/2, w ) );
  MyLine( rook_image, Point( 3*w/4, 7*w/8 ), Point( 3*w/4, w ) );

  imshow( atom_window, atom_image );
  moveWindow( atom_window, 0, 200 );
  imshow( rook_window, rook_image );
  moveWindow( rook_window, w, 200 );

  waitKey( 0 );
  return(0);
}

//画椭圆的函数
void MyEllipse( Mat img, double angle )
{
  int thickness = 2;
  int lineType = 8;

  ellipse( img,
       Point( w/2, w/2 ),
       Size( w/4, w/16 ),
       angle,
       0,
       360,
       Scalar( 255, 0, 0 ),
       thickness,
       lineType );
}

//画圆
void MyFilledCircle( Mat img, Point center )
{
  int thickness = -1;
  int lineType = 8;

  circle( img,
      center,
      w/32,
      Scalar( 0, 0, 255 ),
      thickness,
      lineType );
}

//画多边形
void MyPolygon( Mat img )
{
  int lineType = 8;

  /** Create some points */
  Point rook_points[1][20];
  rook_points[0][0]  = Point(    w/4,   7*w/8 );
  rook_points[0][1]  = Point(  3*w/4,   7*w/8 );
  rook_points[0][2]  = Point(  3*w/4,  13*w/16 );
  rook_points[0][3]  = Point( 11*w/16, 13*w/16 );
  rook_points[0][4]  = Point( 19*w/32,  3*w/8 );
  rook_points[0][5]  = Point(  3*w/4,   3*w/8 );
  rook_points[0][6]  = Point(  3*w/4,     w/8 );
  rook_points[0][7]  = Point( 26*w/40,    w/8 );
  rook_points[0][8]  = Point( 26*w/40,    w/4 );
  rook_points[0][9]  = Point( 22*w/40,    w/4 );
  rook_points[0][10] = Point( 22*w/40,    w/8 );
  rook_points[0][11] = Point( 18*w/40,    w/8 );
  rook_points[0][12] = Point( 18*w/40,    w/4 );
  rook_points[0][13] = Point( 14*w/40,    w/4 );
  rook_points[0][14] = Point( 14*w/40,    w/8 );
  rook_points[0][15] = Point(    w/4,     w/8 );
  rook_points[0][16] = Point(    w/4,   3*w/8 );
  rook_points[0][17] = Point( 13*w/32,  3*w/8 );
  rook_points[0][18] = Point(  5*w/16, 13*w/16 );
  rook_points[0][19] = Point(    w/4,  13*w/16 );

  const Point* ppt[1] = { rook_points[0] };
  int npt[] = { 20 };

  fillPoly( img,
        ppt,
        npt,
          1,
        Scalar( 255, 255, 255 ),
        lineType );
}

//画直线的函数
void MyLine( Mat img, Point start, Point end )
{
  int thickness = 2;
  int lineType = 8;
  line( img,
    start,
    end,
    Scalar( 0, 0, 0 ),
    thickness,
    lineType );
}
3.结果
4.其他说明
Point结构:
定义一个”点“,x参数和y参数。
Scalar结构:
Scalar是有四个元素的容器,可以只使用其部分元素,例如上面使用Scalar(a,b,c)来表示颜色的RGB。


