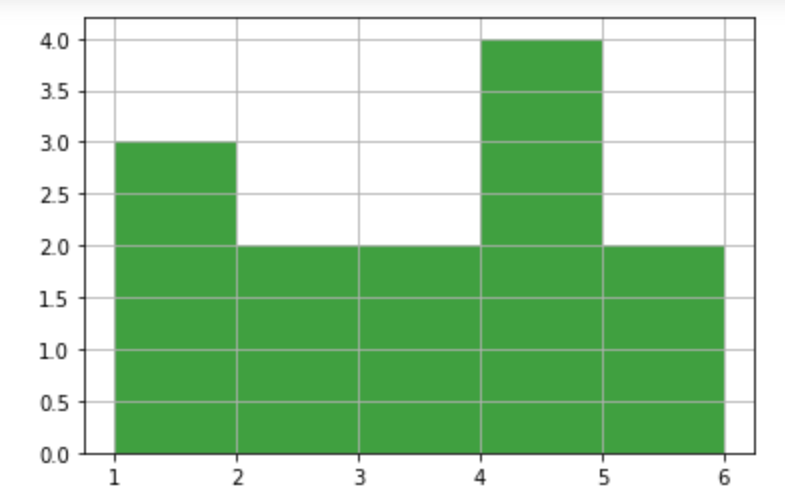
matplotlib画直方图
matplotlib画直方图
一、总结
一句话总结:
a=np.array([1,4,3,2,4,1,4,6,3,2,1,4,6])
plt.hist(a, bins=5, color='g', alpha=0.75) # hist:绘制直方图
# 也就是1-2之间有几个数,2-3之间有几个数
二、matplotlib画直方图
转自或参考:
import numpy as np
import matplotlib.pyplot as plt
a=np.array([1,4,3,2,4,1,4,6,3,2,1,4,6])
plt.hist(a, bins=5, color='g', alpha=0.75)  # hist:绘制直方图
plt.grid()
plt.show()
# 也就是1-2之间有几个数,2-3之间有几个数等


