概率论疑难问题---5、通俗理解中心极限定理
概率论疑难问题---5、通俗理解中心极限定理
一、总结
一句话总结:
中心极限定理(CLT)指出,如果样本量足够大,【则变量均值的采样分布将近似于正态分布,而与该变量在总体中的分布无关】。
二、通俗理解中心极限定理
博客对应课程视频位置:5、通俗理解中心极限定理-范仁义-读书编程笔记
https://www.fanrenyi.com/video/45/388
一、中心极限定理(Central Limit Theorem)
1.1、研究什么
中心极限定理是研究独立随机变量和的极限分布为正态分布的问题。
1.2、定义
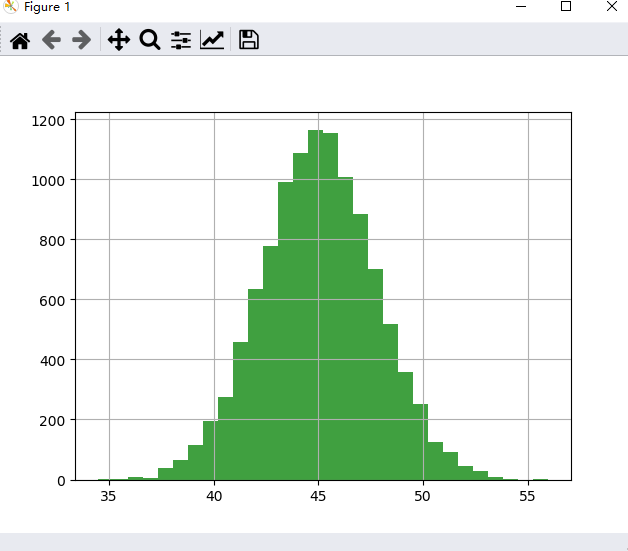
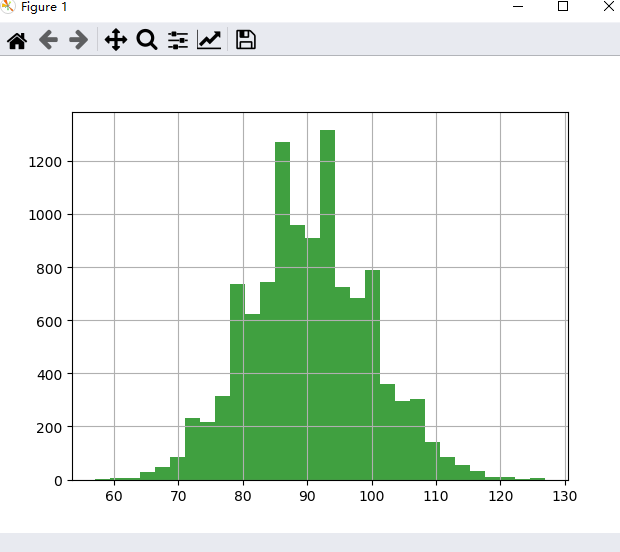
中心极限定理指的是给定一个任意分布的总体,我每次从这些总体中随机抽取 n 个抽样,一共抽 m 次, 然后把这 m 组抽样分别求出和(或者平均值),这些和(或者平均值)的分布接近正态分布。
1.3、通俗解释
中心极限定理就是一般在同分布的情况下,样本值的和在总体数量趋于无穷时的极限分布近似于正态分布.(即在同一分布,抽取样本的极限分布于总体数量趋于无穷大时的极限分布相同且近似于正态分布,那么我们就可以用抽取样本来描述总体样本无穷大时的极限分布)
二、均匀分布
验证这是正儿八经的均匀分布
import numpy as np
import matplotlib.pyplot as plt
from matplotlib import animation
%matplotlib qt5

a=np.array([])
for i in range(110):
    for _ in range(100):
        add_num=np.sum(np.random.rand(1))
        a=np.append(a,add_num)
        pass
    # plt.clf() # Clear the current figure.
    plt.cla()   # Clear the current axes.
    plt.hist(a, bins=30, color='g', alpha=0.75)  # hist:绘制直方图
    plt.grid()
    plt.pause(0.1)
    plt.show()
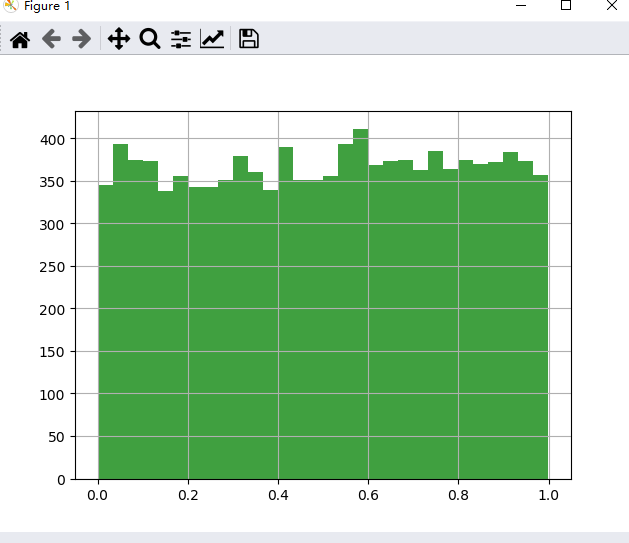
来看看均匀分布对应的中心极限定理
样例: 从均匀分布中每次取90个点求和,取11000次,每100个点显示一次
import numpy as np
import matplotlib.pyplot as plt
from matplotlib import animation
%matplotlib qt5

a=np.array([])
for i in range(110):
    for _ in range(100):
        add_num=np.sum(np.random.rand(90))
        a=np.append(a,add_num)
        pass
    # plt.clf() # Clear the current figure.
    plt.cla()   # Clear the current axes.
    plt.hist(a, bins=30, color='g', alpha=0.75)  # hist:绘制直方图
    plt.grid()
    plt.pause(0.1)
    plt.show()
# help(np.random)
print(dir(np.random))
三、泊松分布
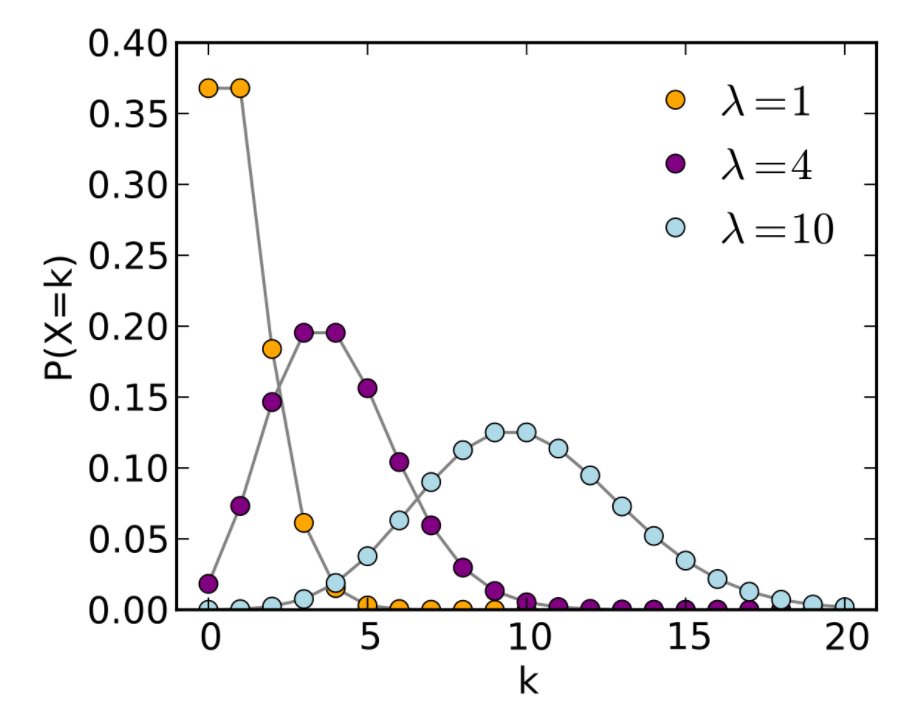
先来看看正儿八经的泊松分布张啥样
import numpy as np
import matplotlib.pyplot as plt
from matplotlib import animation
%matplotlib qt5

a=np.array([])
for i in range(110):
    for _ in range(100):
        add_num=np.sum(np.random.poisson(4)) #默认λ等于1
        a=np.append(a,add_num)
        pass
    # plt.clf() # Clear the current figure.
    plt.cla()   # Clear the current axes.
    plt.hist(a, bins=30, color='g', alpha=0.75)  # hist:绘制直方图
    plt.grid()
    plt.pause(0.1)
    plt.show()

看看每次取90个值求和之后的效果
import numpy as np
import matplotlib.pyplot as plt
from matplotlib import animation
%matplotlib qt5

print(np.random.poisson(1,90))

a=np.array([])
for i in range(110):
    for _ in range(100):
        add_num=np.sum(np.random.poisson(1,90))
        a=np.append(a,add_num)
        pass
    # plt.clf() # Clear the current figure.
    plt.cla()   # Clear the current axes.
    plt.hist(a, bins=30, color='g', alpha=0.75)  # hist:绘制直方图
    plt.grid()
    plt.pause(0.1)
    plt.show()
四、指数分布
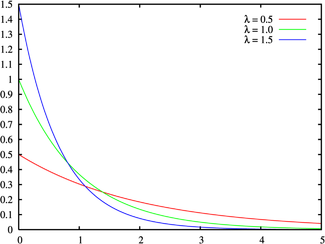
import numpy as np
import matplotlib.pyplot as plt
from matplotlib import animation
%matplotlib qt5

a=np.array([])
for i in range(110):
    for _ in range(100):
        add_num=np.sum(np.random.exponential(1))
        a=np.append(a,add_num)
        pass
    # plt.clf() # Clear the current figure.
    plt.cla()   # Clear the current axes.
    plt.hist(a, bins=30, color='g', alpha=0.75)  # hist:绘制直方图
    plt.grid()
    plt.pause(0.1)
    plt.show()
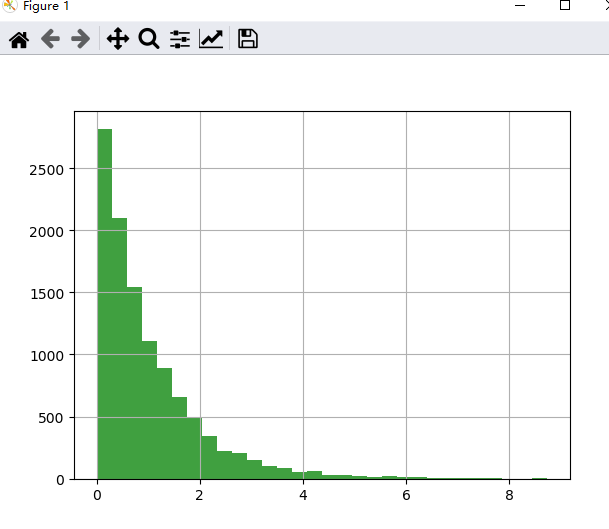
看看每次取90个值求和之后的效果
import numpy as np
import matplotlib.pyplot as plt
from matplotlib import animation
%matplotlib qt5

# print(np.random.exponential(1,20))
# print(np.sum(np.random.exponential(1,20)))

a=np.array([])
for i in range(110):
    for _ in range(100):
        add_num=np.sum(np.random.exponential(1,90))
        a=np.append(a,add_num)
        pass
    # plt.clf() # Clear the current figure.
    plt.cla()   # Clear the current axes.
    plt.hist(a, bins=30, color='g', alpha=0.75)  # hist:绘制直方图
    plt.grid()
    plt.pause(0.1)
    plt.show()

五、总结
中心极限定理(CLT)指出,如果样本量足够大,【则变量均值的采样分布将近似于正态分布,而与该变量在总体中的分布无关】。
系列课程视频位置:
1、全概率公式和贝叶斯公式-范仁义-读书编程笔记
https://www.fanrenyi.com/video/45/382
2、通俗理解泊松分布-范仁义-读书编程笔记
https://www.fanrenyi.com/video/45/385
3、通俗理解协方差与相关系数-范仁义-读书编程笔记
https://www.fanrenyi.com/video/45/386
4、通俗理解概率论中的“矩”-范仁义-读书编程笔记
https://www.fanrenyi.com/video/45/387
5、通俗理解中心极限定理-范仁义-读书编程笔记
https://www.fanrenyi.com/video/45/388
6、极大似然估计-范仁义-读书编程笔记
https://www.fanrenyi.com/video/45/389
7、通俗理解最小二乘法-范仁义-读书编程笔记
https://www.fanrenyi.com/video/45/390


