Lending Club 公司2007-2018贷款业务初步分析
数据来源:https://www.kaggle.com/wendykan/lending-club-loan-data
数据描述:LendingClub是一家美国P2P借贷公司,总部位于加利福尼亚州旧金山。这是第一个对等网络贷款人登记其产品为证券与证券交易委员会(SEC),并在二级市场上提供贷款交易。LendingClub是世界上最大的点对点借贷平台。这些文件包含 LENGDING CLUB 公司 2007-2015 年间发放的所有贷款的完整贷款数据,包括当前贷款状态(“当前”,“延迟”,“已全额付款”等)和最新付款信息。该文件是约226万个观测值和145个字段的矩阵,字段包括信用评分,财务查询数量,包括邮政编码的地址,状态以及收款等信息。 数据字段字典在单独的文件中提供。
一、LENDING CLUB 背景了解
1.1 公司发展历程

图1 Lending Club 发展历程
-
2007年,Lending Club 成立,主营业务是为市场提供P2P贷款的平台中介服务。与已运营两年的占据美国 P2P 市场最大份额的 Prosper 形成差异化竞争。初期为了对平台进行第一轮推广,希望利用社交网络发现潜在客户,与 Facebook 合作,但其用户大部分为年轻人,不具备贷款投资能力,这样的合作为其带来了巨大的点击率但没有带来足够的贷款量增长。9月份,Lending Club 对社交方式进行调整,投向更多社交平台以外的用户,自此快速发展。
-
2008年3月,美国证券交易委员会 SEC 将 Lending Club 平台出手的票据认定为票据,需要平台对其进行注册。4月7日,进入半年的注册等待期。完成 SEC 注册后,为了增加贷款投资的流动性,Lending Club 与经济交易商 FOLIOfn (平台运营者,只撮合双方交易,不参与做市)合作建立了二级交易平台。二级交易平台的建立,使投资者持有的收益权凭证能够和股票一样在二级市场上交易,迅速变现。
-
2011年11月,Lending Club 创办了全资子公司 LC Advisors,LC Advisors是一家 SEC 认可的投资咨询公司,专门负责管理 Lending Club 大型投资者的投资。
-
2014年12月,Lending Club 在纽交所上市,成为当年最大的科技股IPO。
-
2015年2月3日起,阿里巴巴宣布将和 Lending Club 合作,为向中国供应商采购商品的美国小企业提供贷款。
-
2015年2月10日,LC 宣布和美国 200 家银行达成合作关系。BancAlliance 是一个由资产2亿到100亿美元不等的200家社区银行组成的联盟。
-
2016年5月9日,Lending Club 首席执行官 Renaud Laplanche 宣布辞职。在一场内部调查中,董事会发现公司存在向机构投资者舞弊,数据造假等问题。另外 Renaud Laplanche 还未能尽到披露义务,说明自己已持有一家投资基金的股份,并主导了Lending Club对这家公司的投资。
-
2016-2018,Lending Club 股价下跌,治理丑闻,此时,其他许多 P2P 公司也遇到了困难。
-
2019年12月,执行官Valerie Kay指出,LendingClub已通过一个名为``Scale''的新项目将重点转移到机构投资者以及其传统的点对点贷款,该项目专注于提供代表性贷款样本而不是个人贷款。LendingClub在2018年的年度贷款发放额已增长至108亿美元。
1.2 贷款业务过程
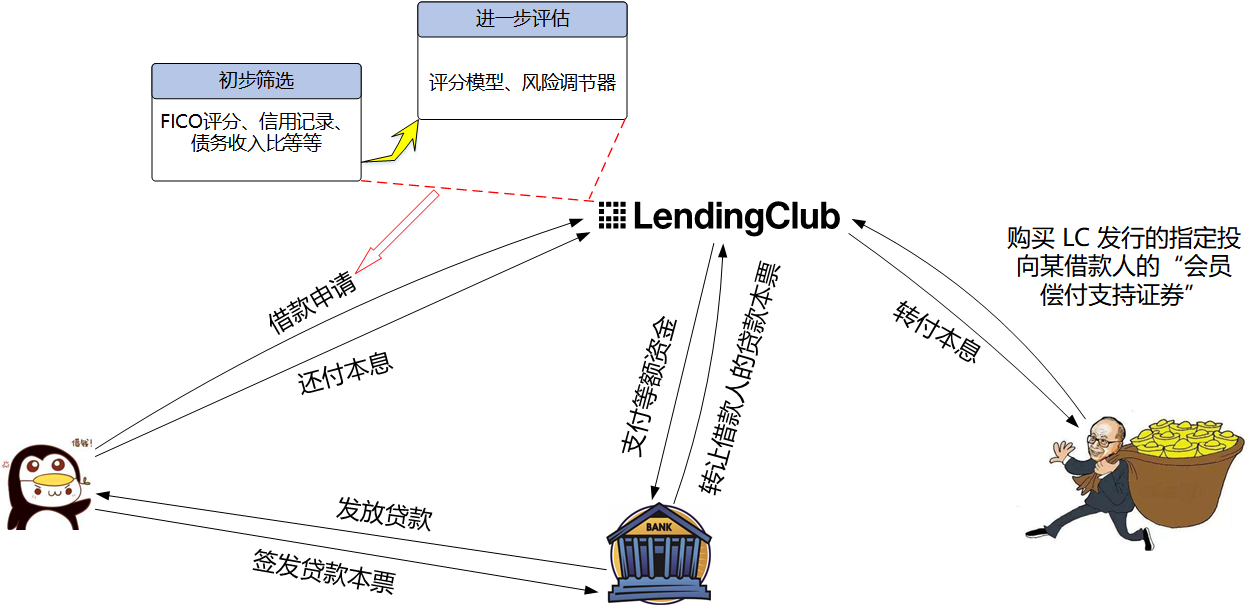
图2 Lending Club 贷款业务过程
贷款人希望在 Lending Club 平台借款时,首先需要在平台上发布借款请求,请求中包含很多有关借款人的信息,如借款人的 FICO 分数,信用级别,借款目的,借款期限,借款金额,借款进度,借款人收入,月还款额,债务收入比,就业状况,信用记录等。但是,投资者和借款人在 Lending Club 上都是匿名的,双方在交易过程中并不清楚对方的真实身份,这正是 Lending Club 要为客户保护的。投资人(出借者)可以浏览借款列表选中自己认可的借款人来投资,也可以根据自己的偏好设定投资组合。待各个投资者承诺的出借金额的累加达到了借款人所需要的总金额,或自借款请求列表发布日起已累计达 14 天,借款人资金募集就完成或结束。随后,Lending Club 和 WebBank 就会开始对分别对借款人和投资者发放贷款和票据。一般来说,一次借贷短则几个小时最多 14 天,平均五到六天就可以完成。二、 LENDING CLUB 数据分析
2.1 分析框架
数据提供的字段有145个之多,为了对数据有个初步了解,可以使用谷歌翻译直接对数据字典进行翻译,挑选出与用户画像、业务最相关的一些字段,如下图3。
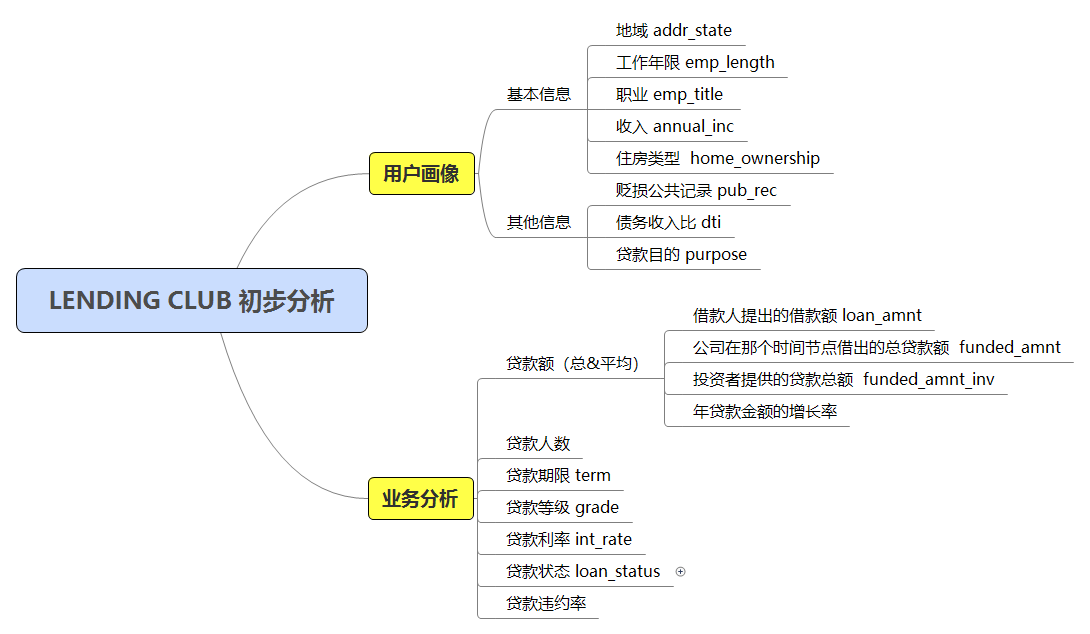
图3 Lending Club 初步分析框架
2.2 分析结论
用户画像
-
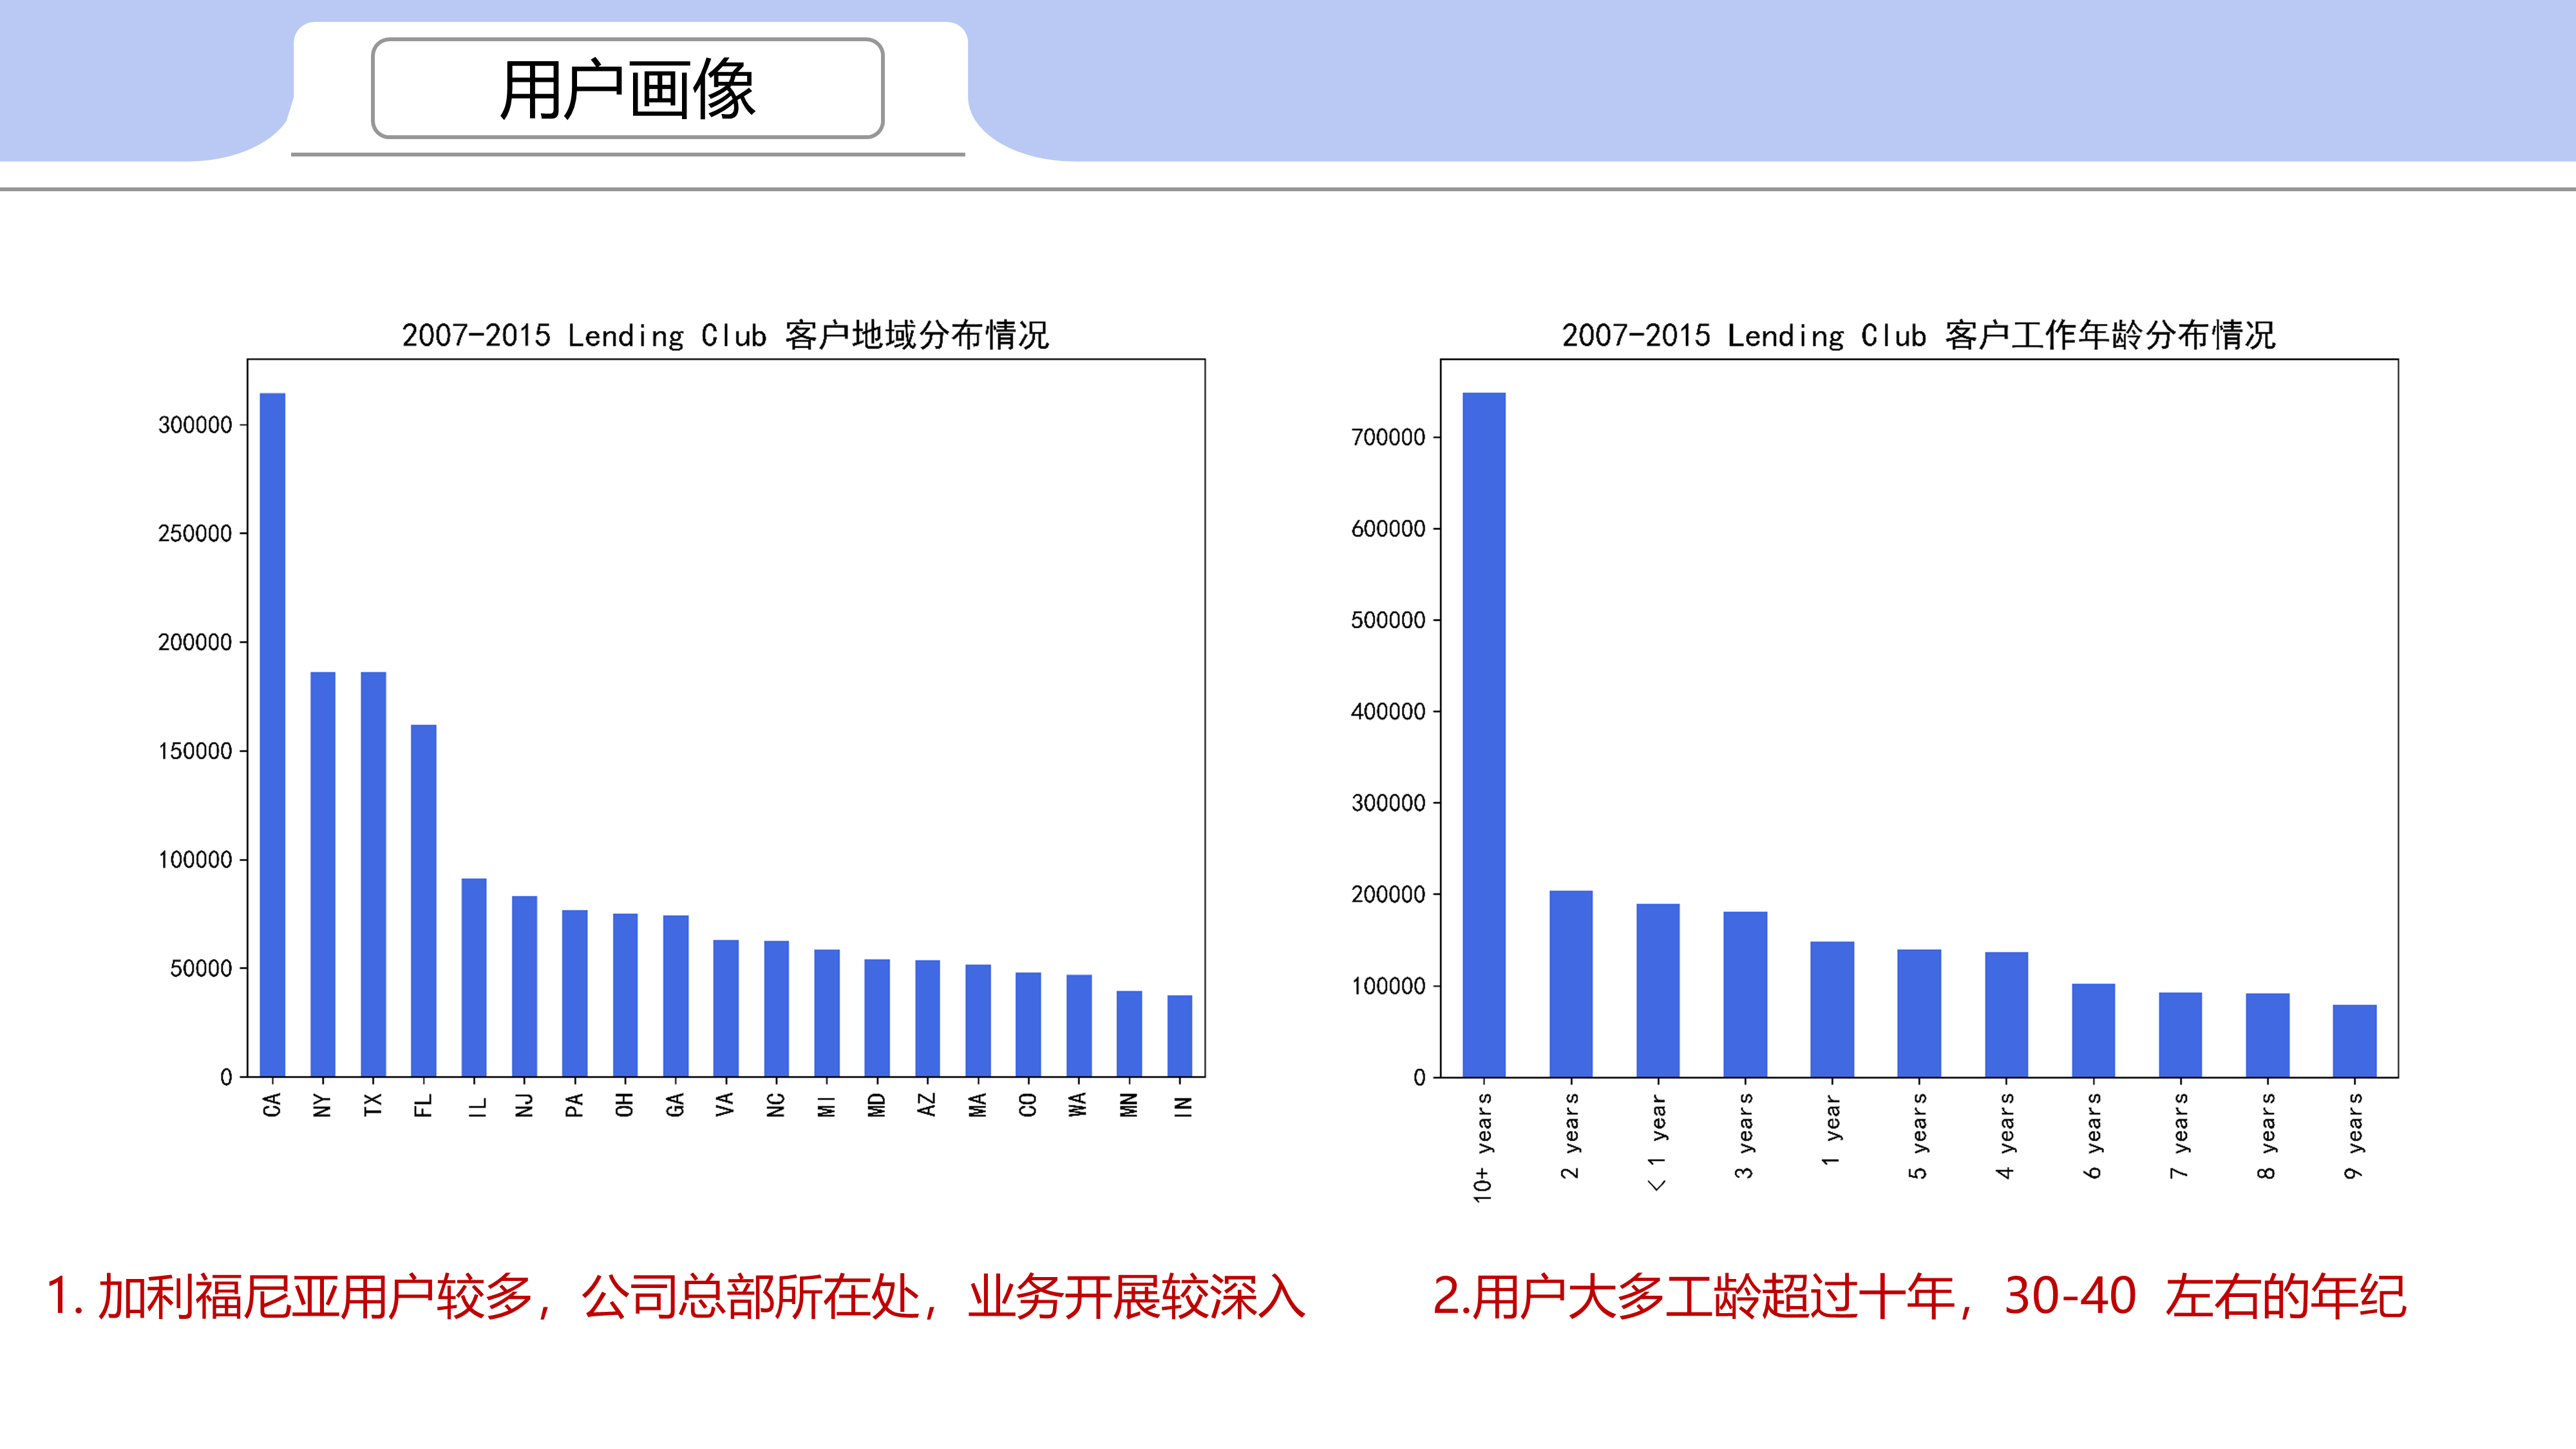
加利福尼亚用户较多,公司总部所在处,业务开展较深入
-
用户大多工龄超过十年,30-40 左右的年纪
-
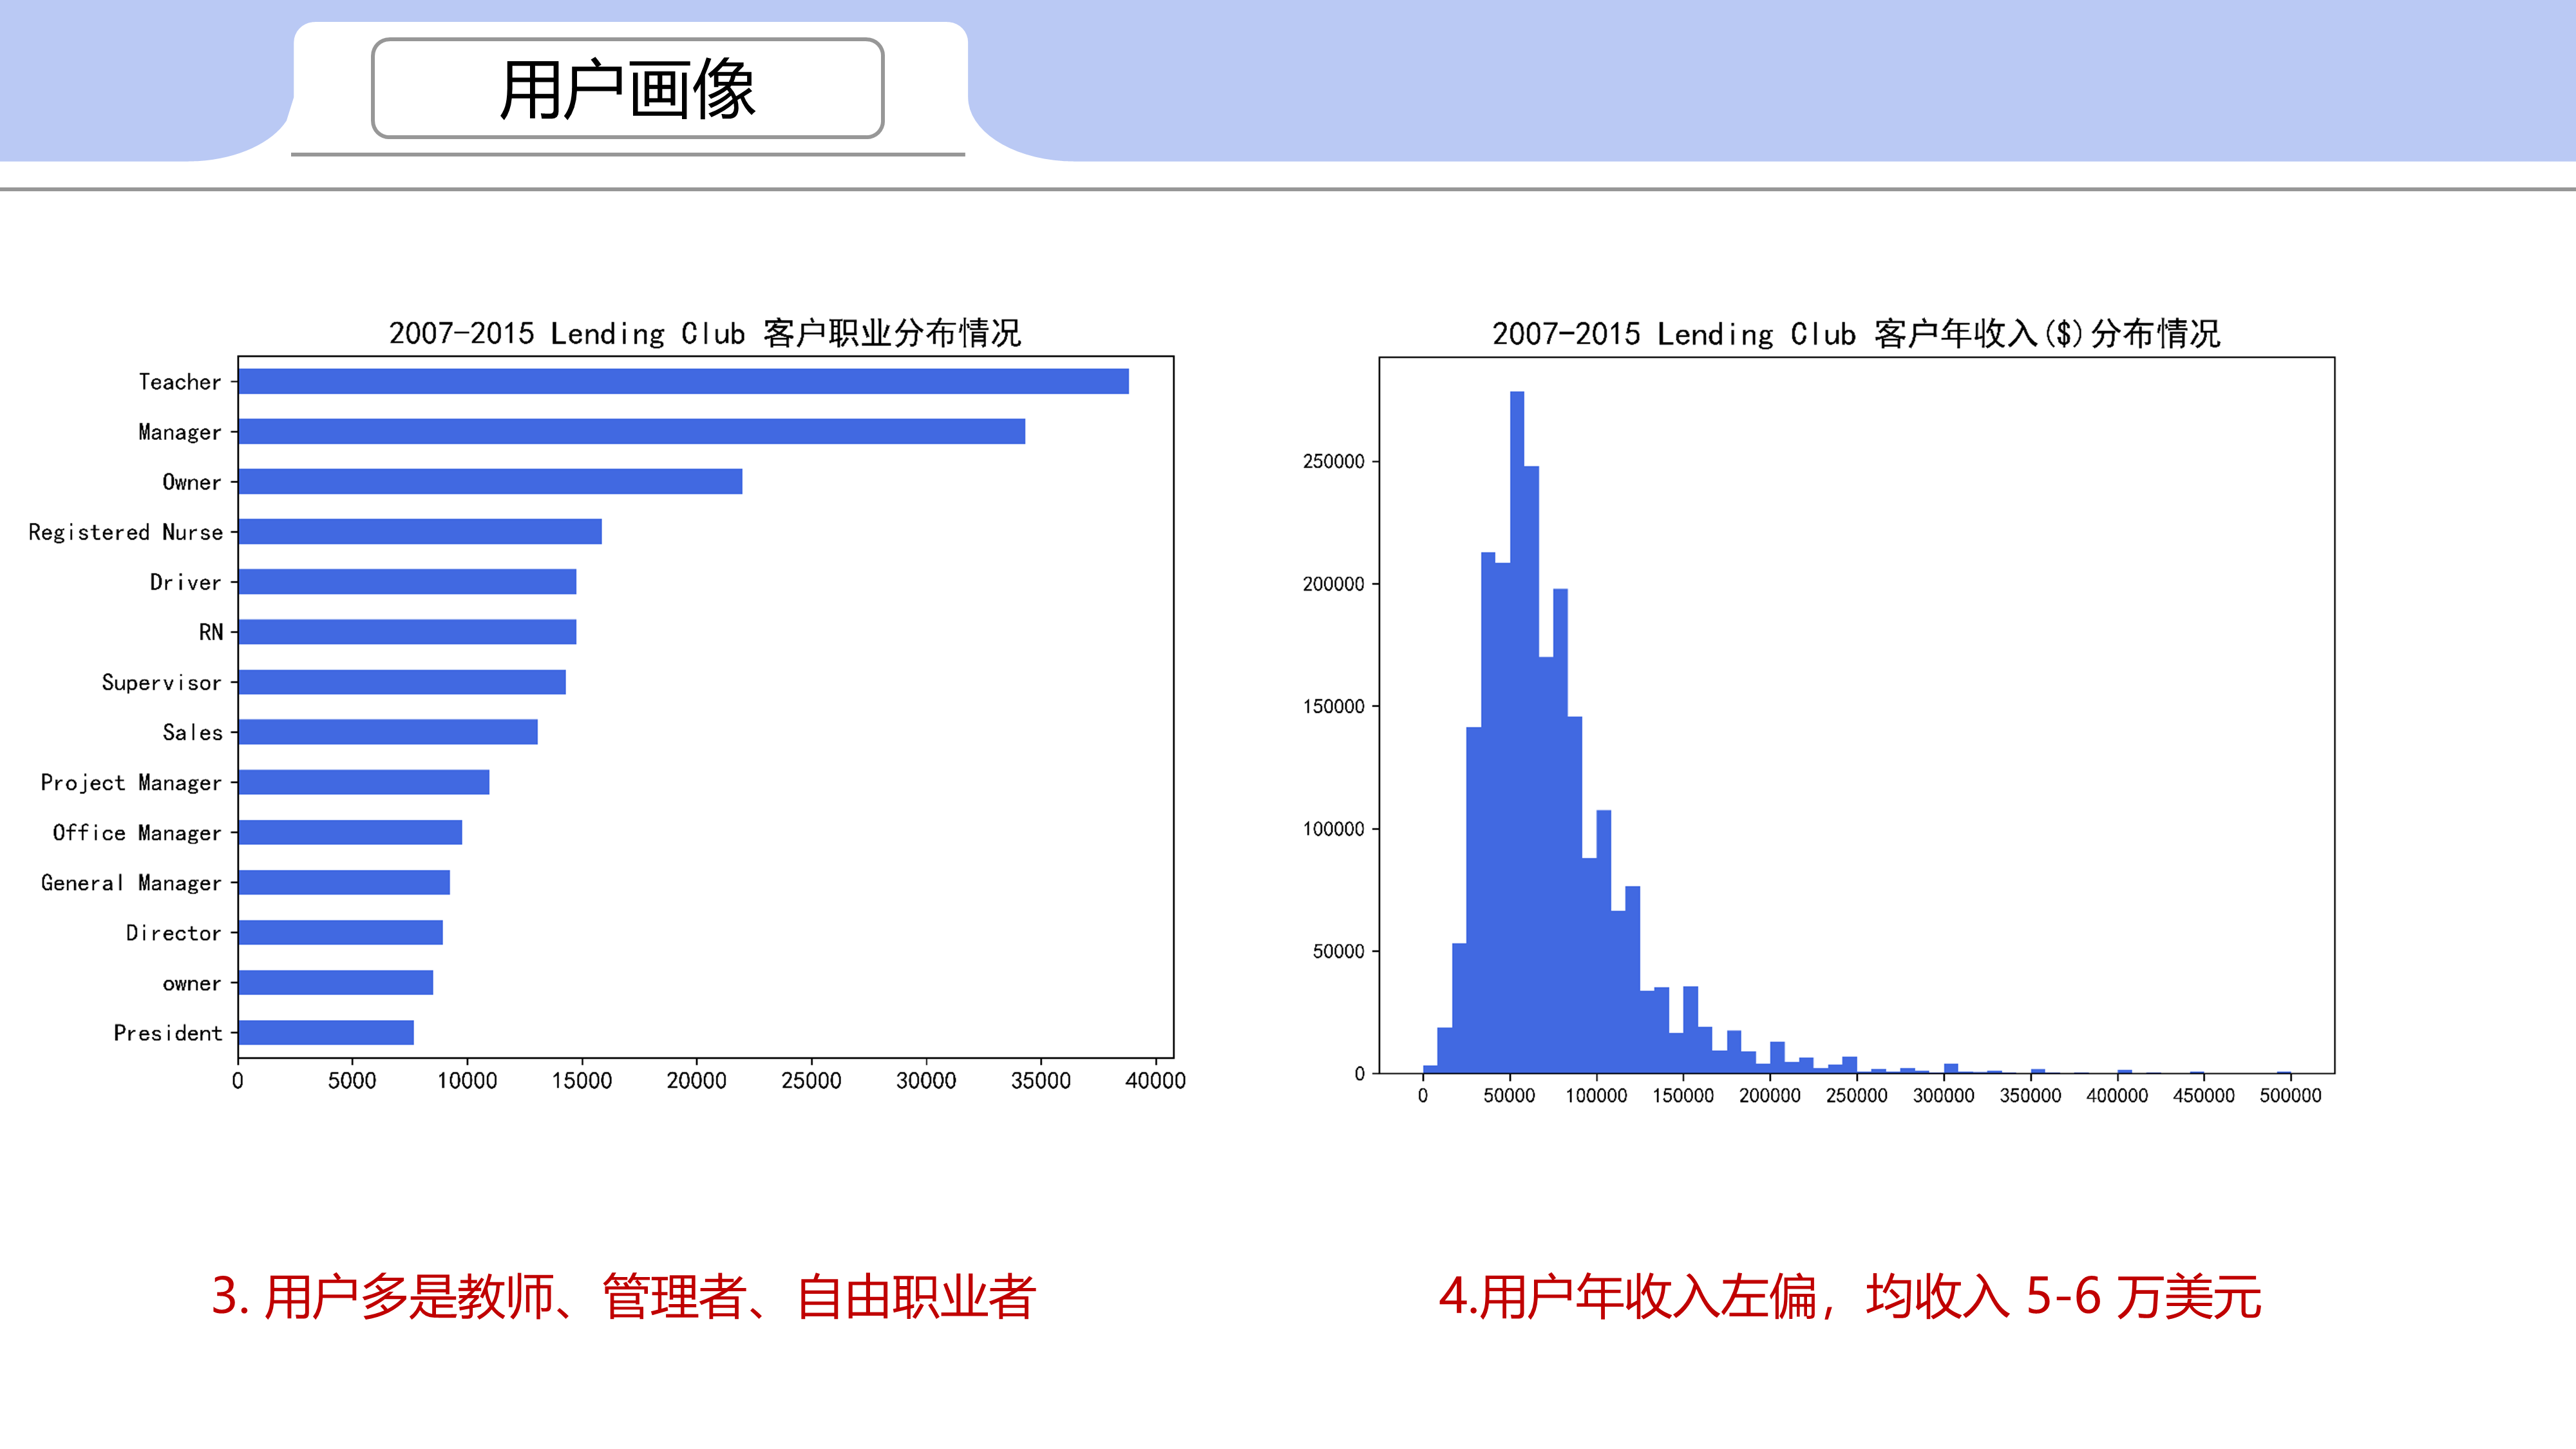
用户多是教师、管理者、自由职业者
-
用户年收入左偏,均收入 5-6 万美元
-
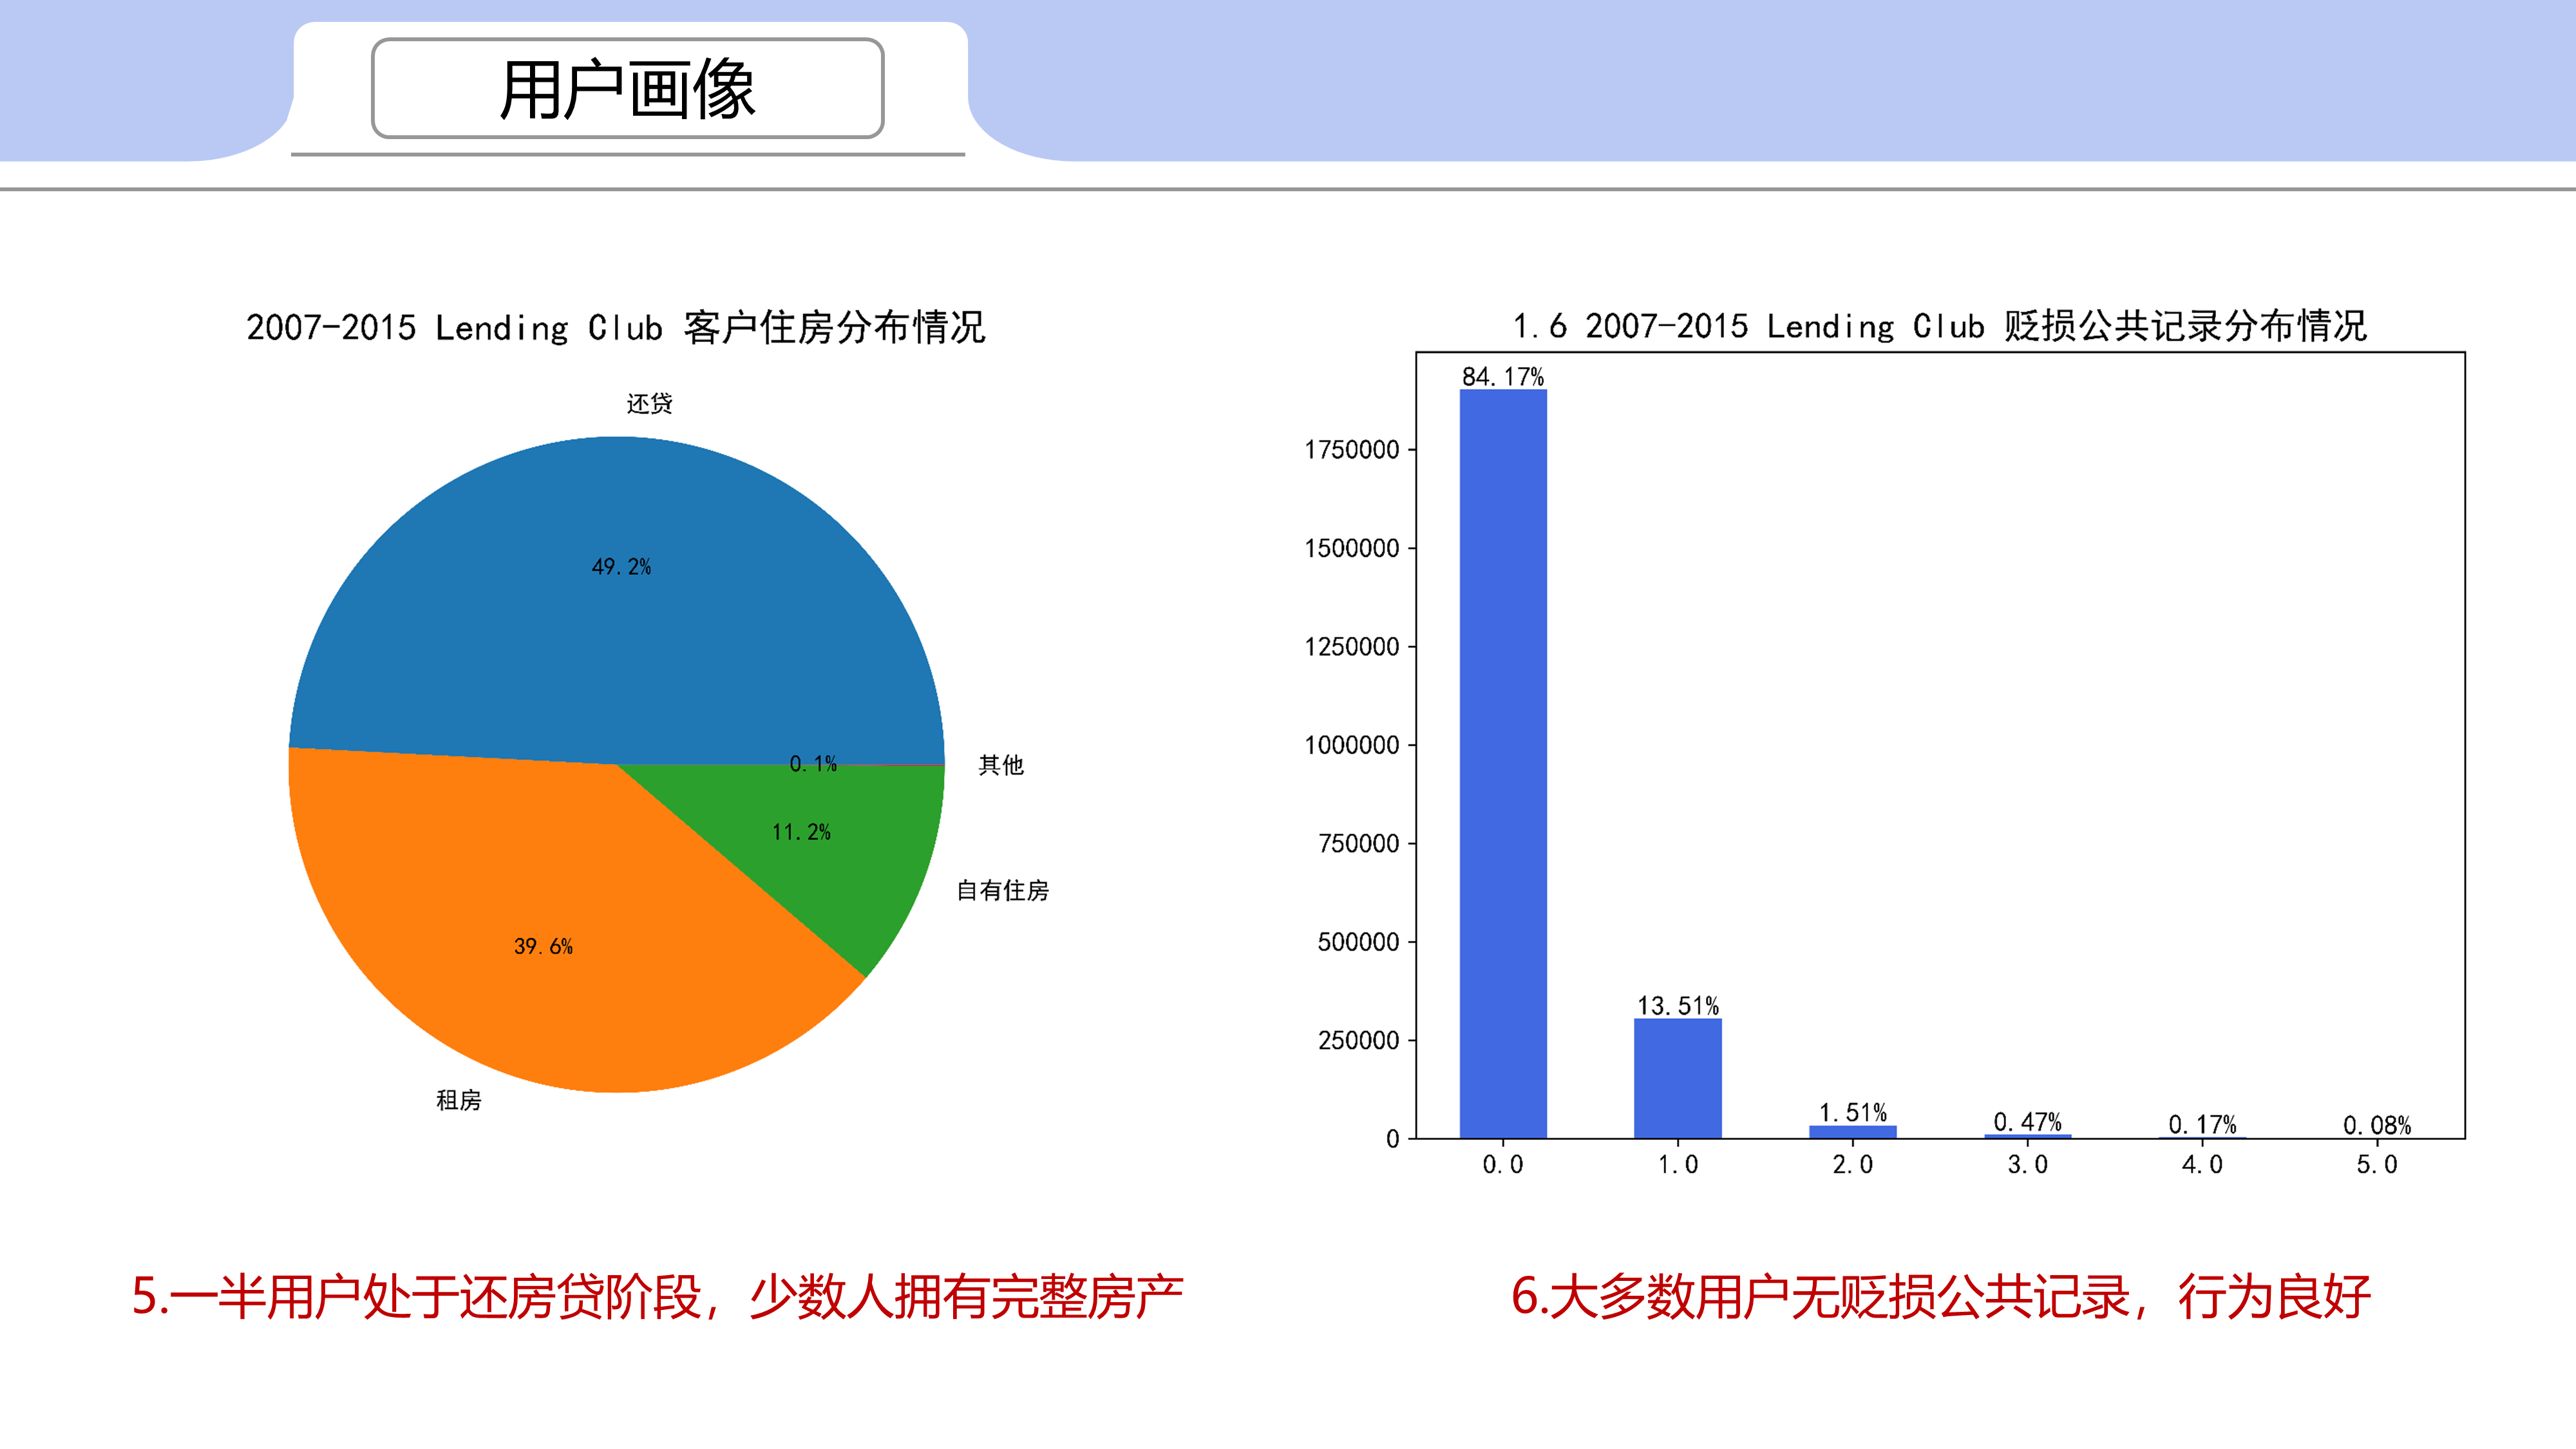
一半用户处于还房贷阶段,少数人拥有完整房产
-
大多数用户无贬损公共记录,行为良好
-
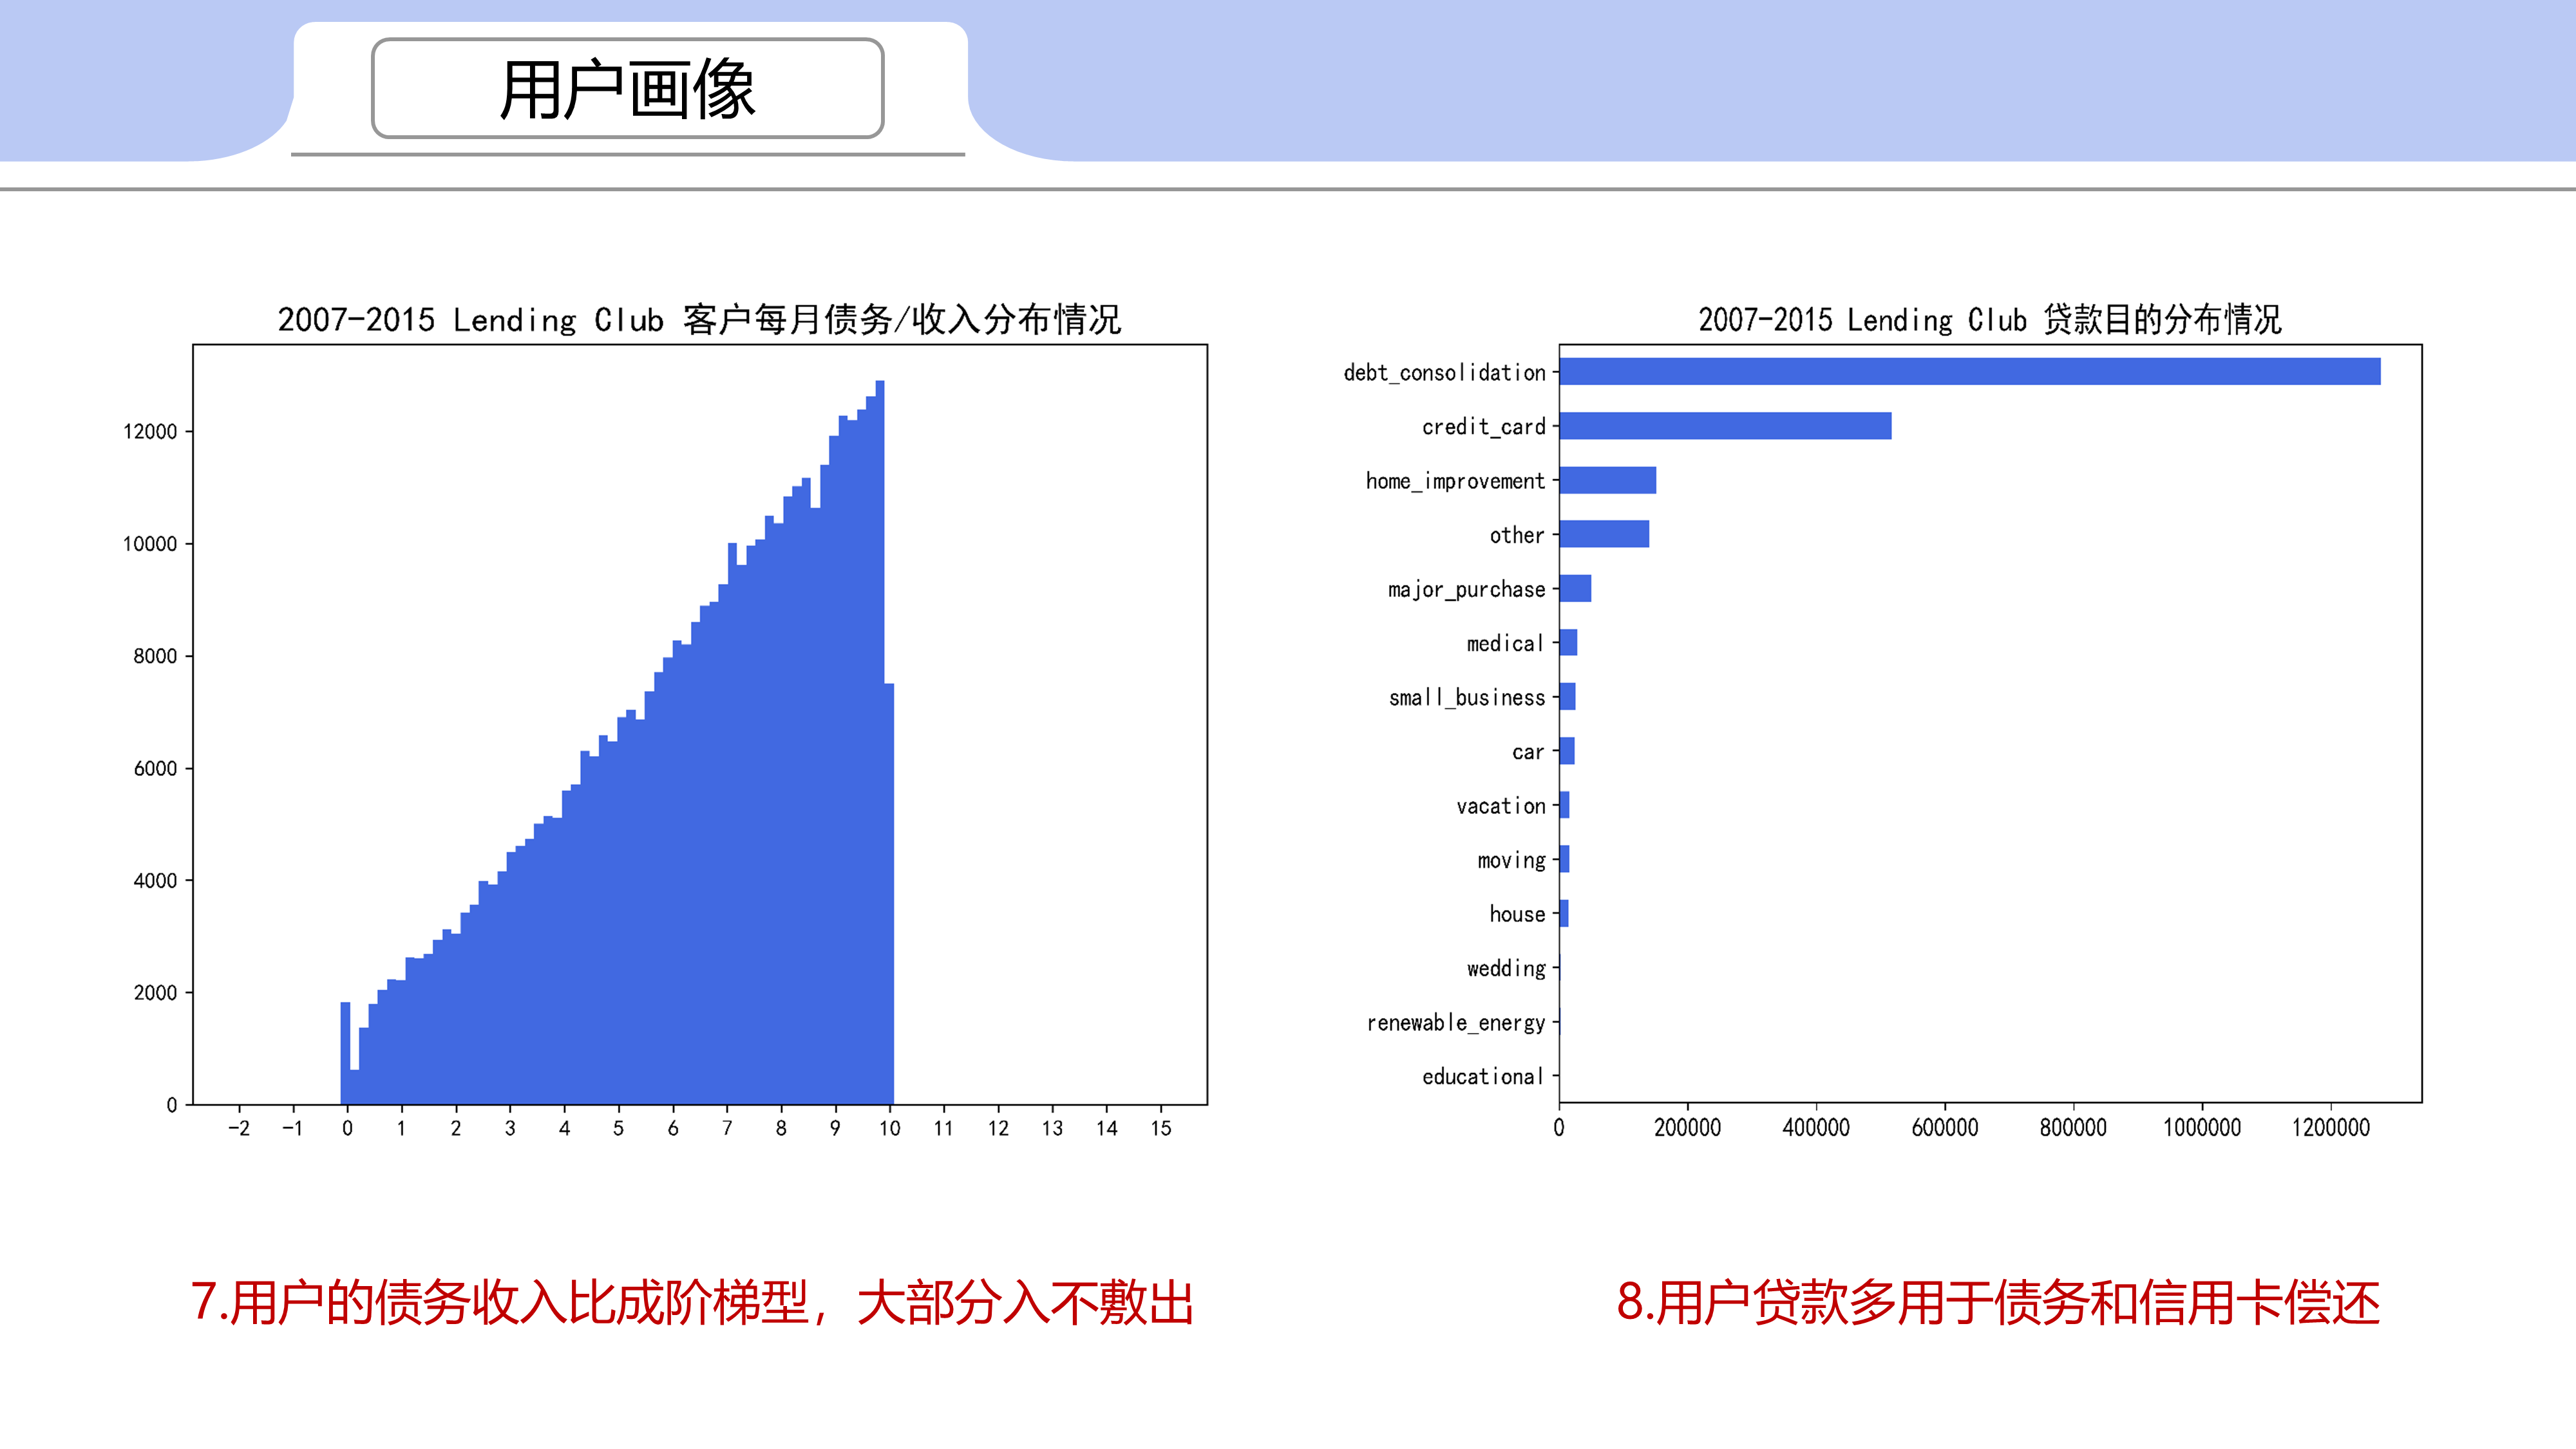
用户的债务收入比成阶梯型,大部分入不敷出
-
用户贷款多用于债务和信用卡偿还
业务分析
- 贷款额相关
-
-
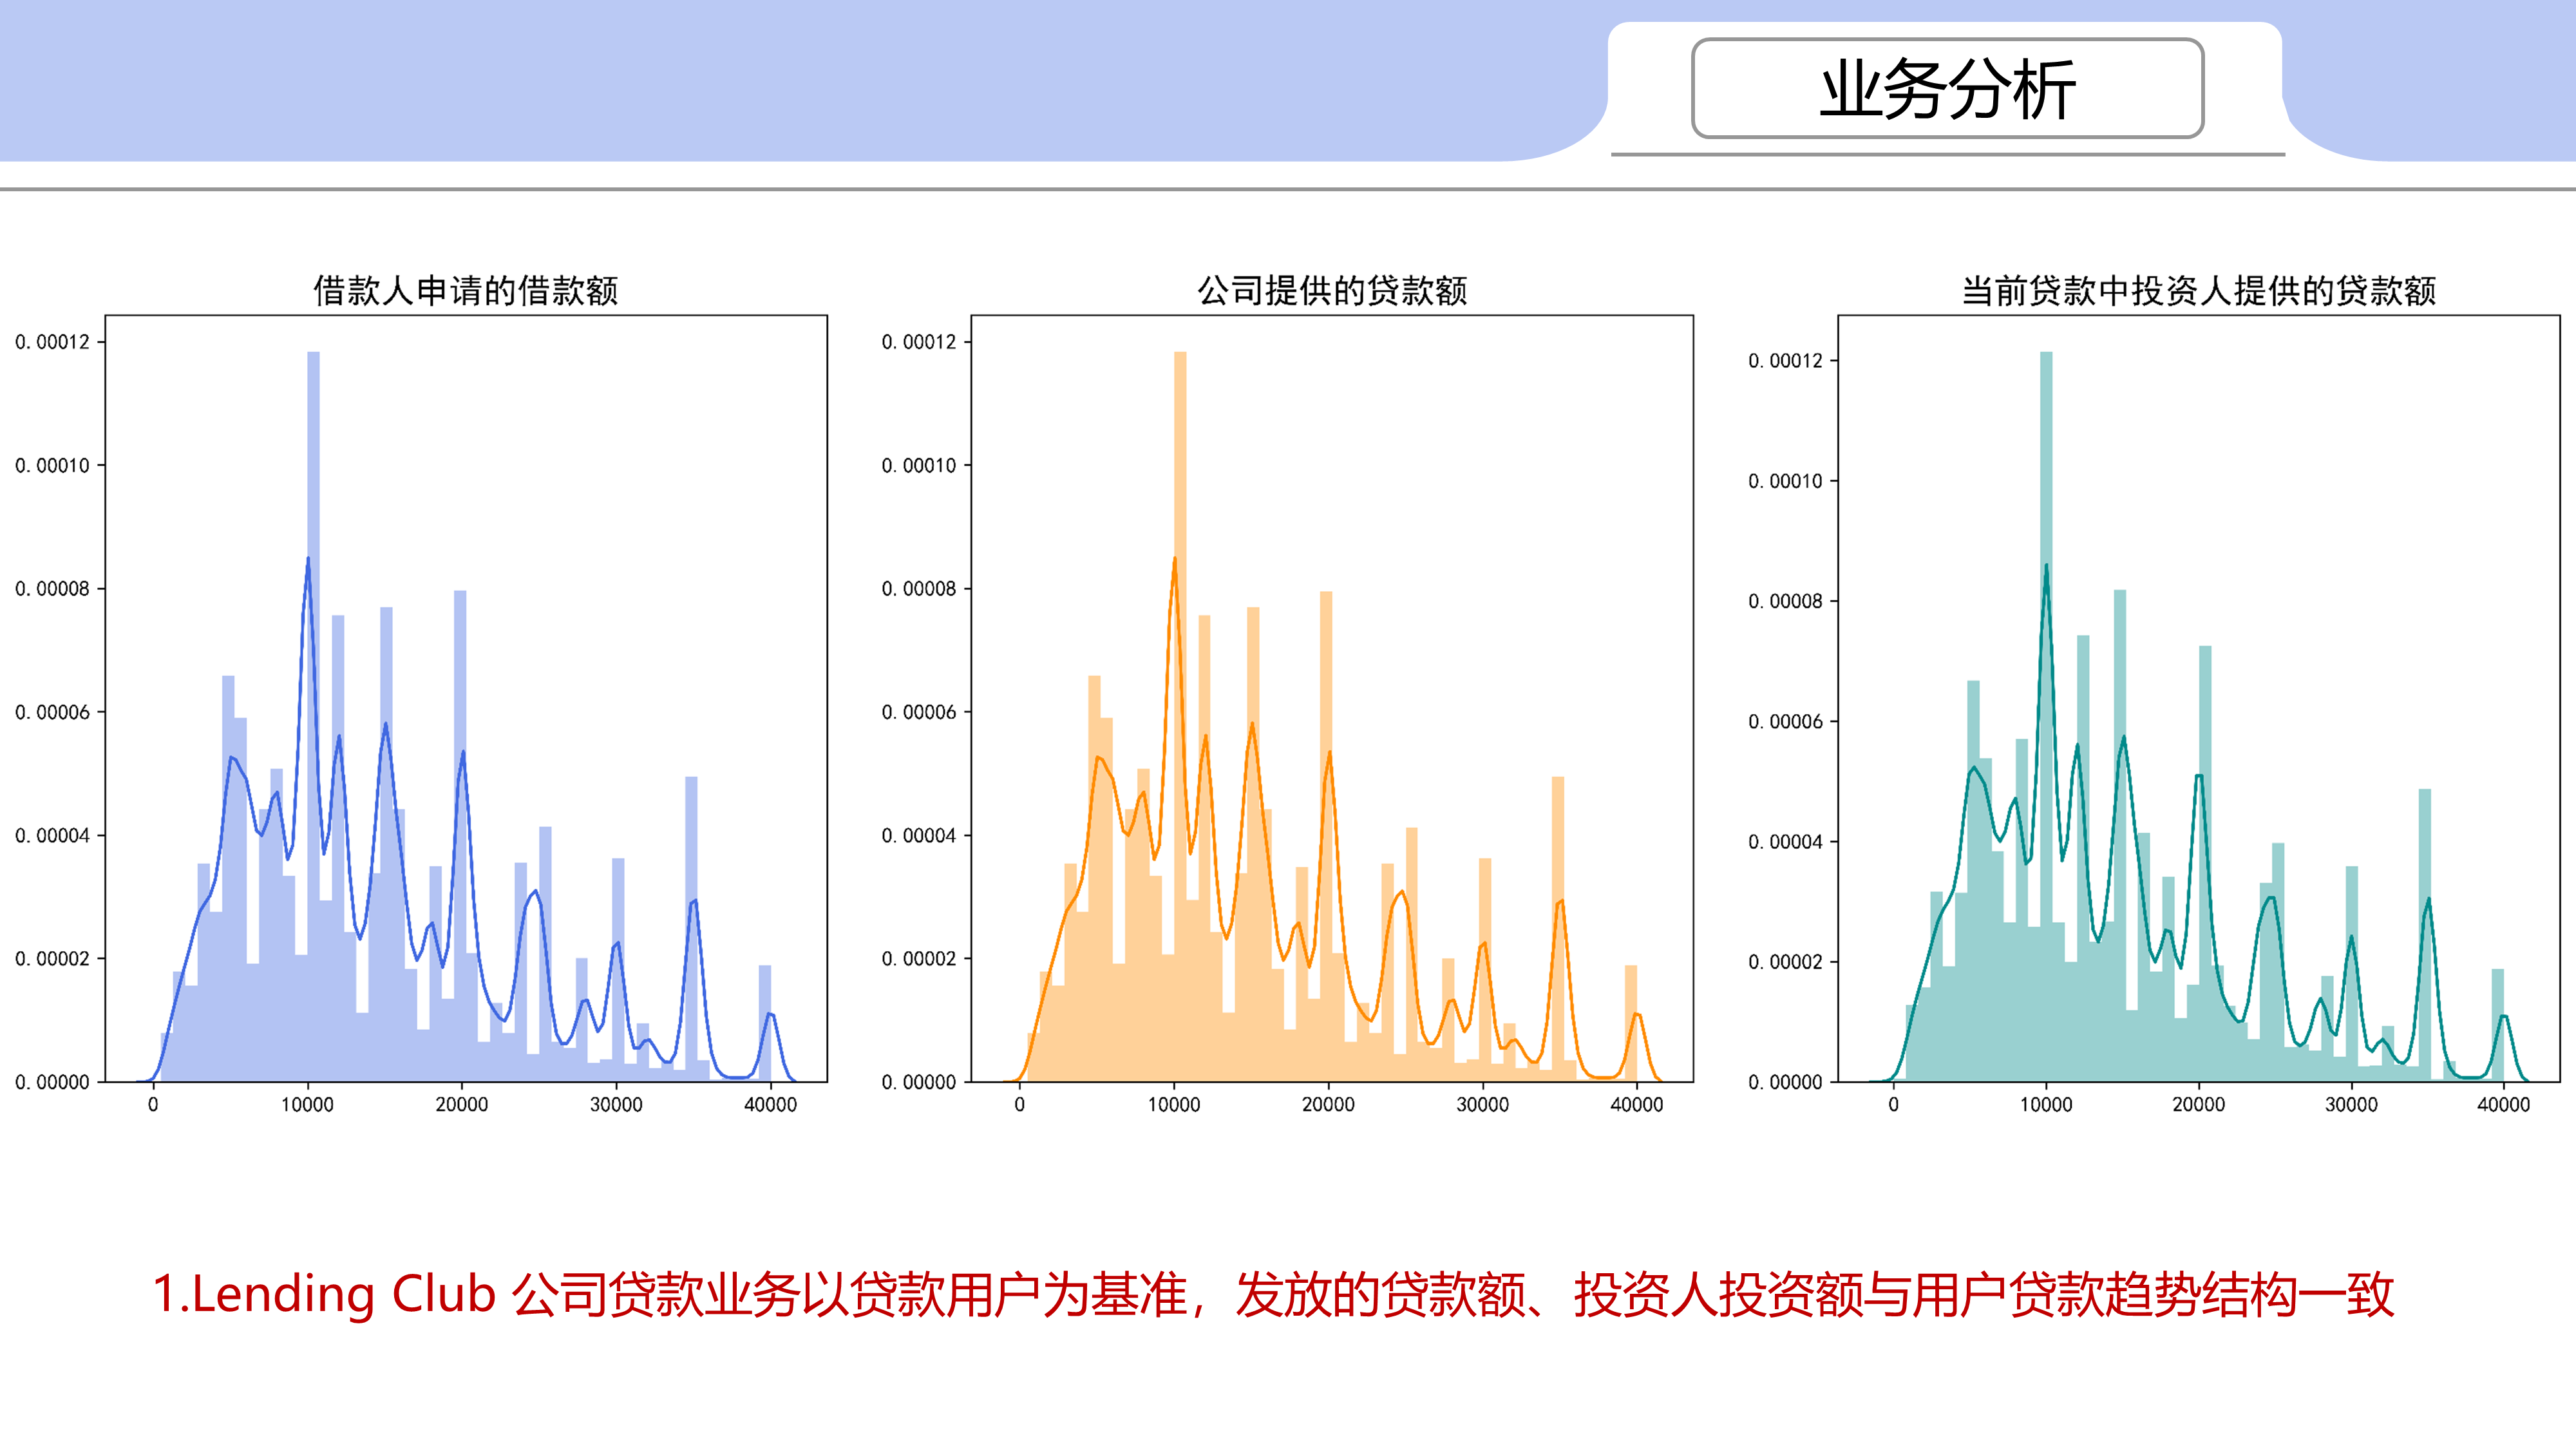
Lending Club 公司贷款业务以贷款用户为基准,发放的贷款额、投资人投资额与用户贷款趋势结构一致
-
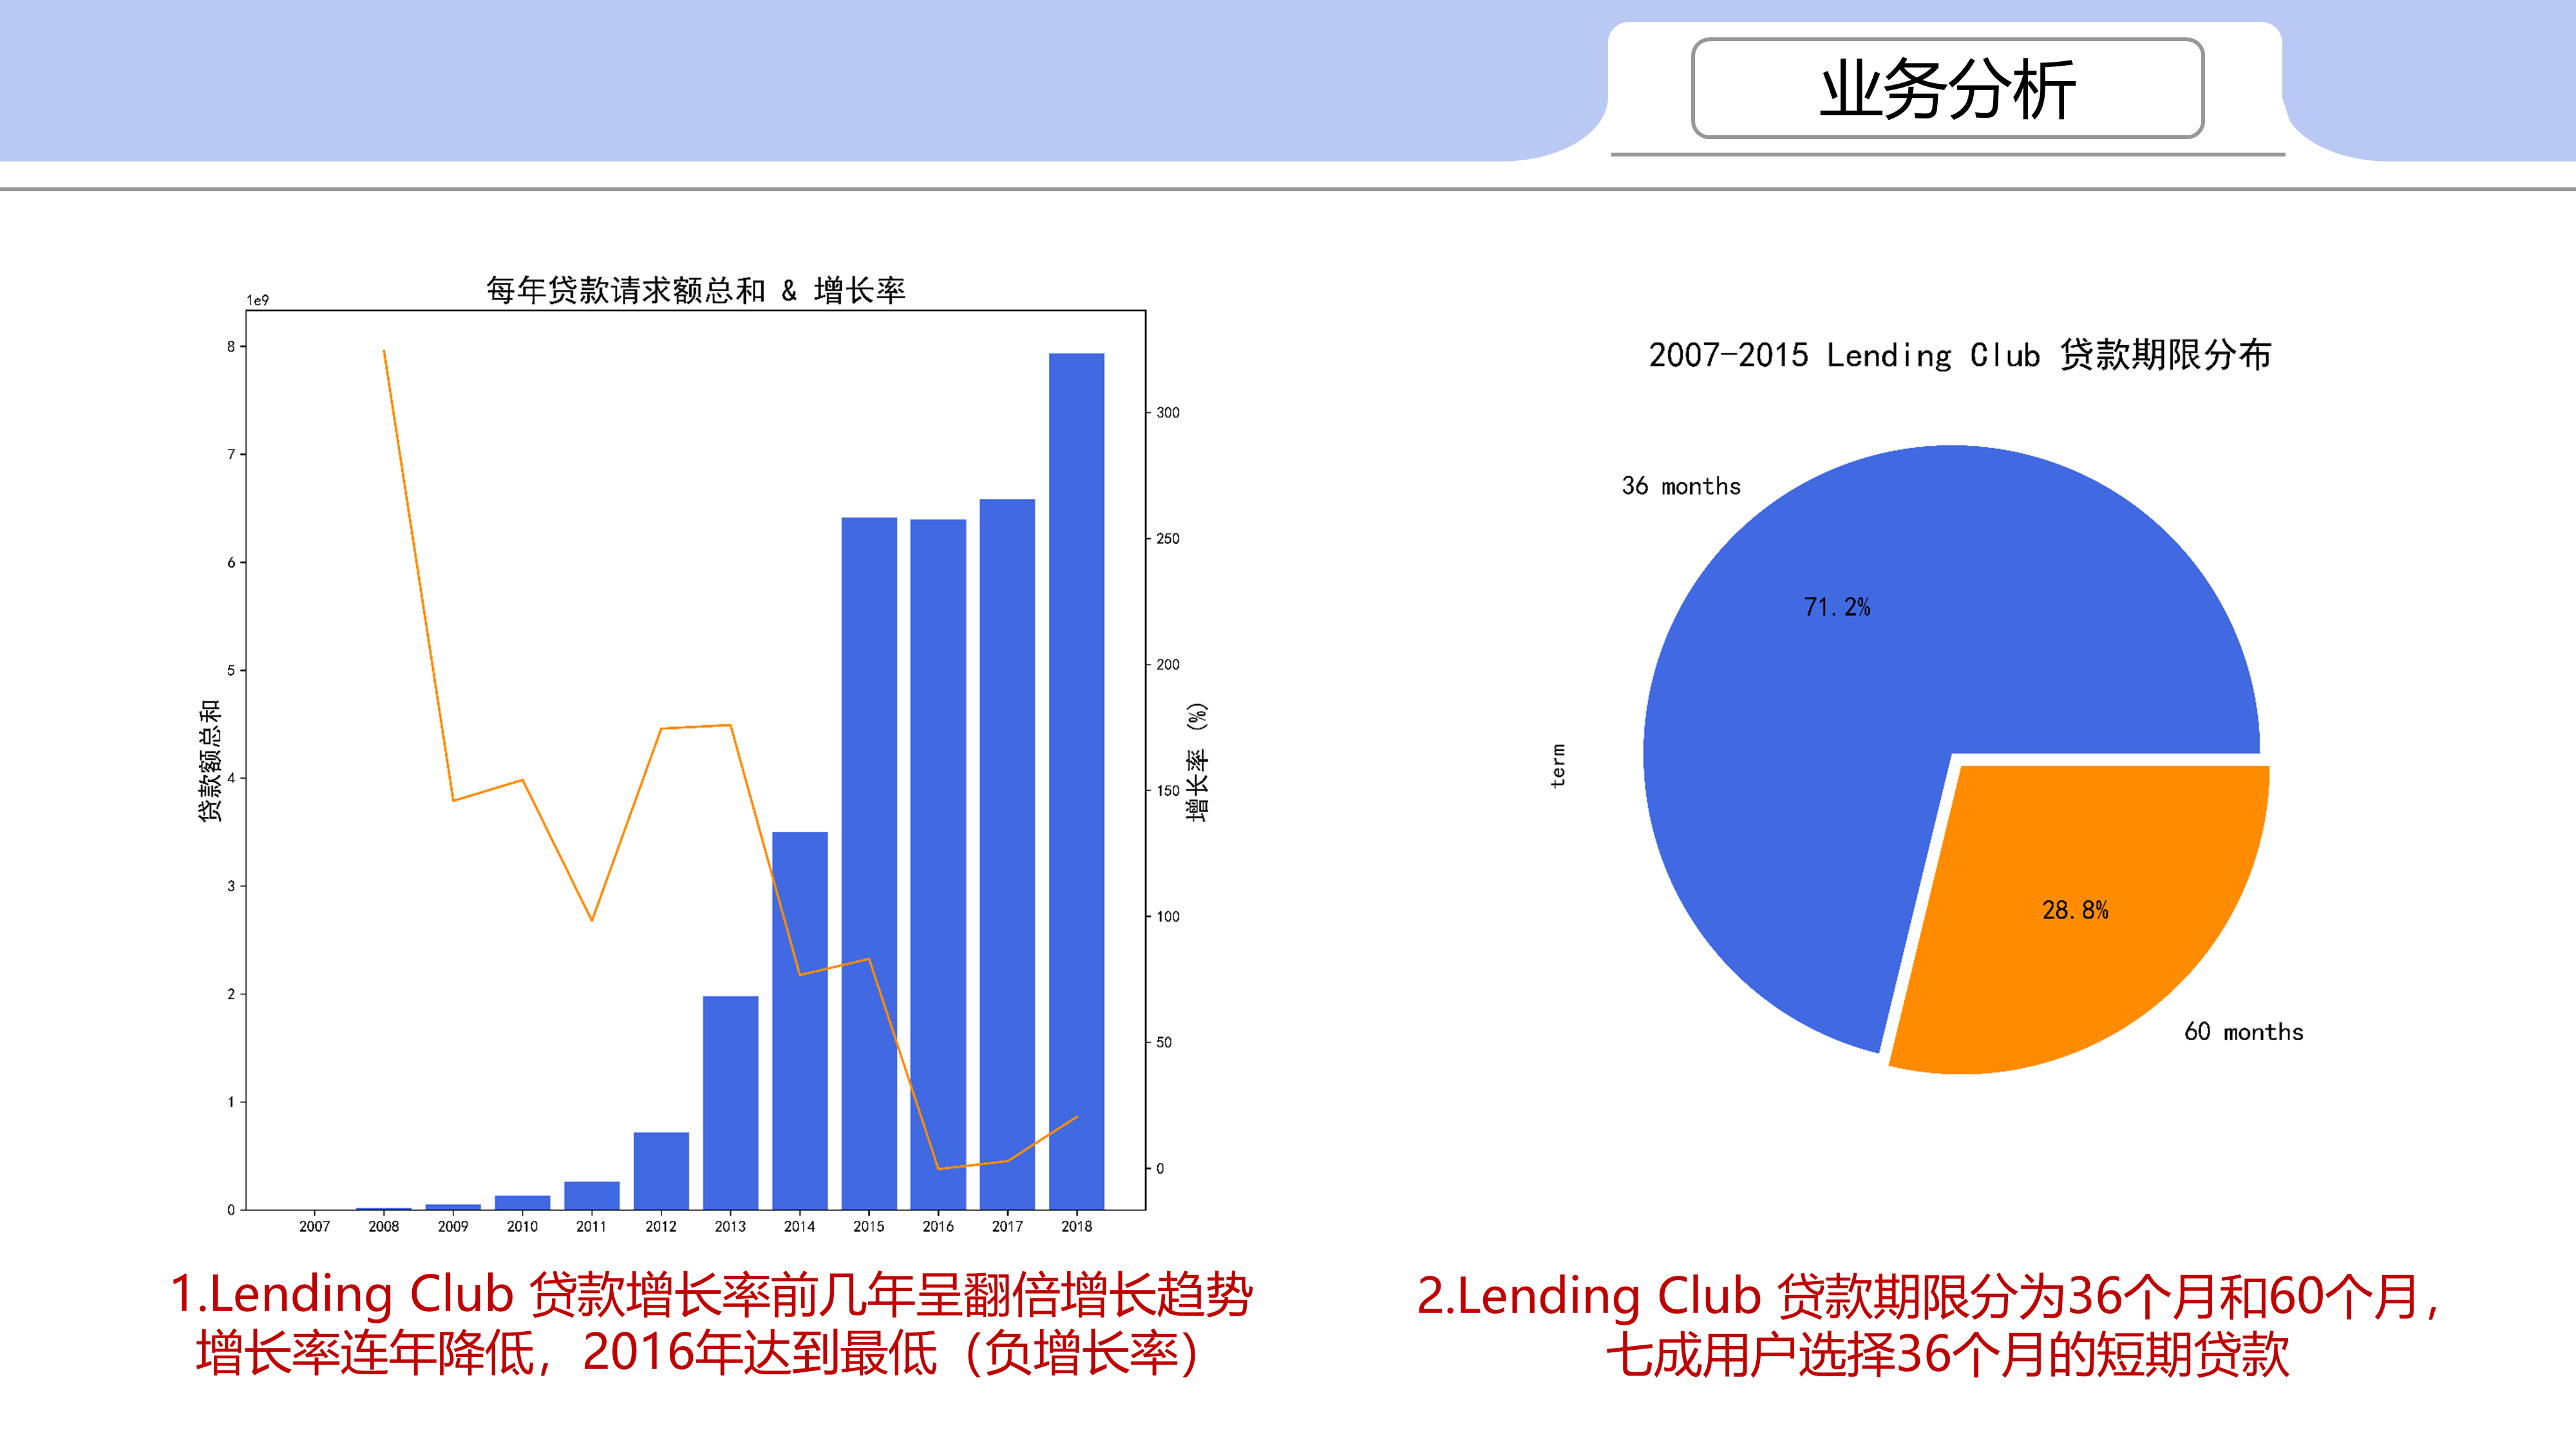
Lending Club 贷款增长率前几年呈翻倍增长趋势,增长率连年降低,2016年达到最低(负增长率,与爆出的丑闻有直接关系)
-
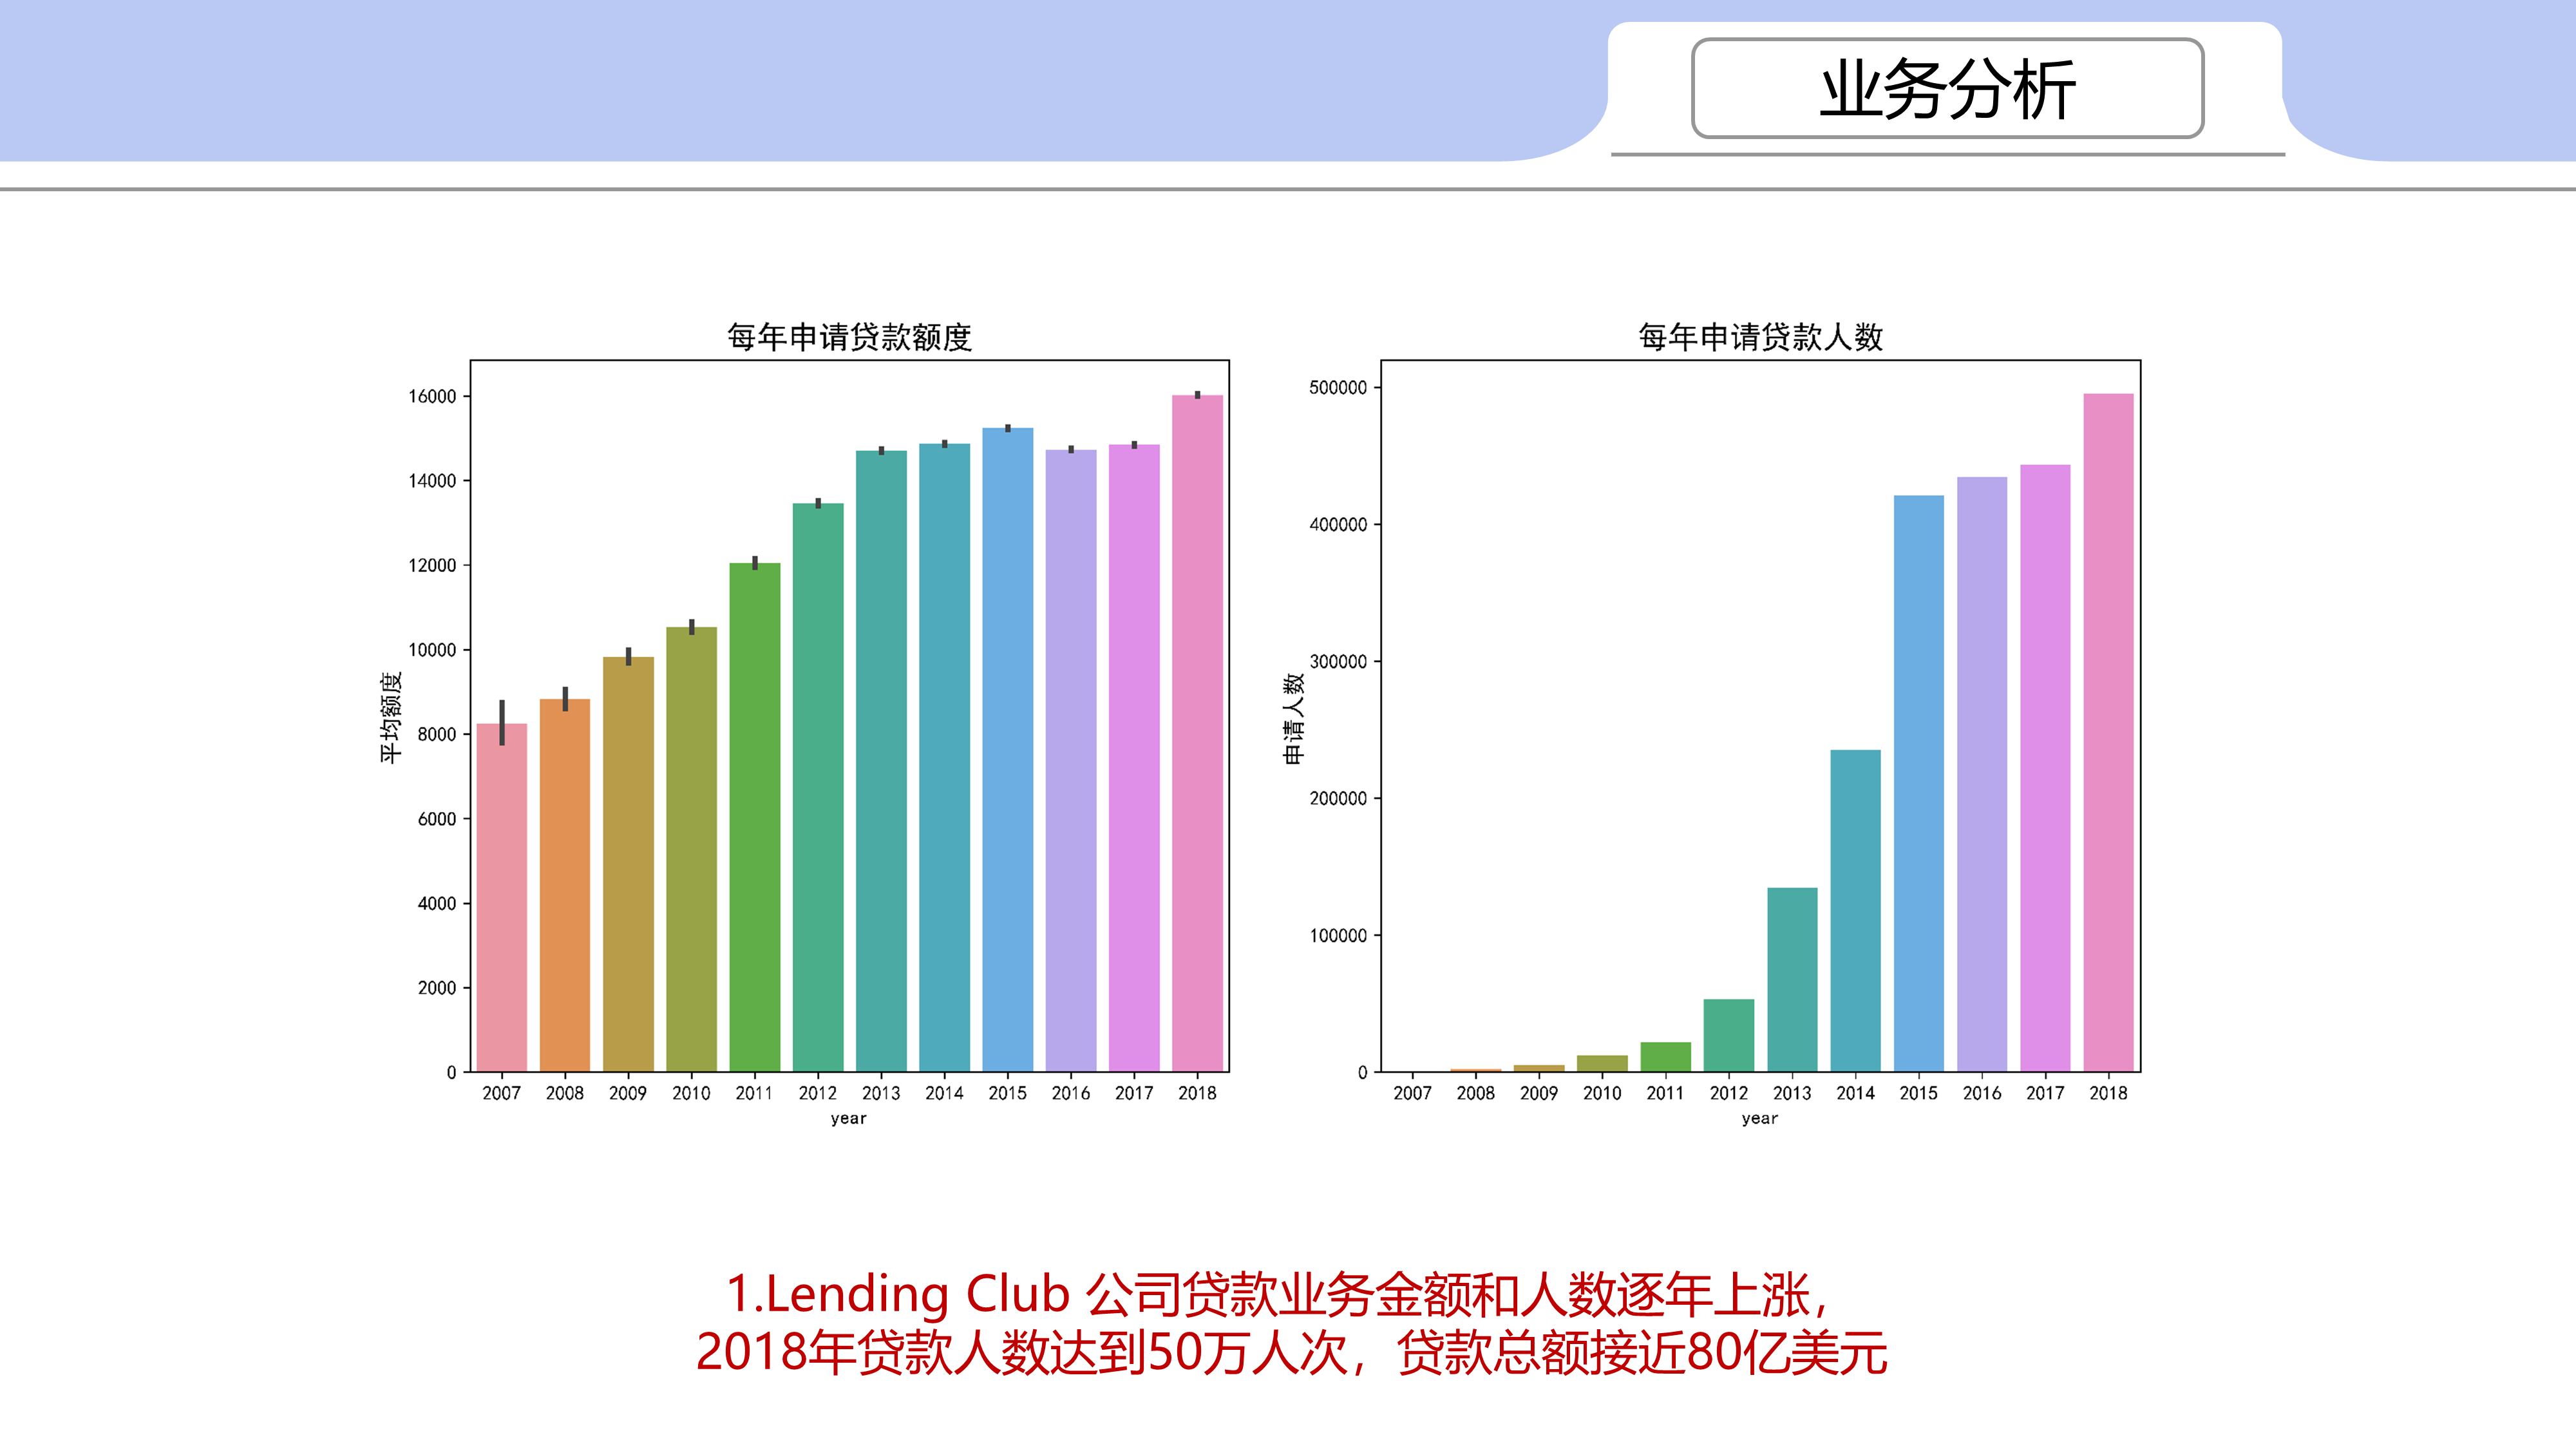
Lending Club 公司贷款业务金额和人数逐年上涨,
-
2018年贷款人数达到50万,贷款总额接近80亿美元
-
-
Lending Club 贷款期限分为36个月和60个月,七成用户选择36个月的短期贷款
-
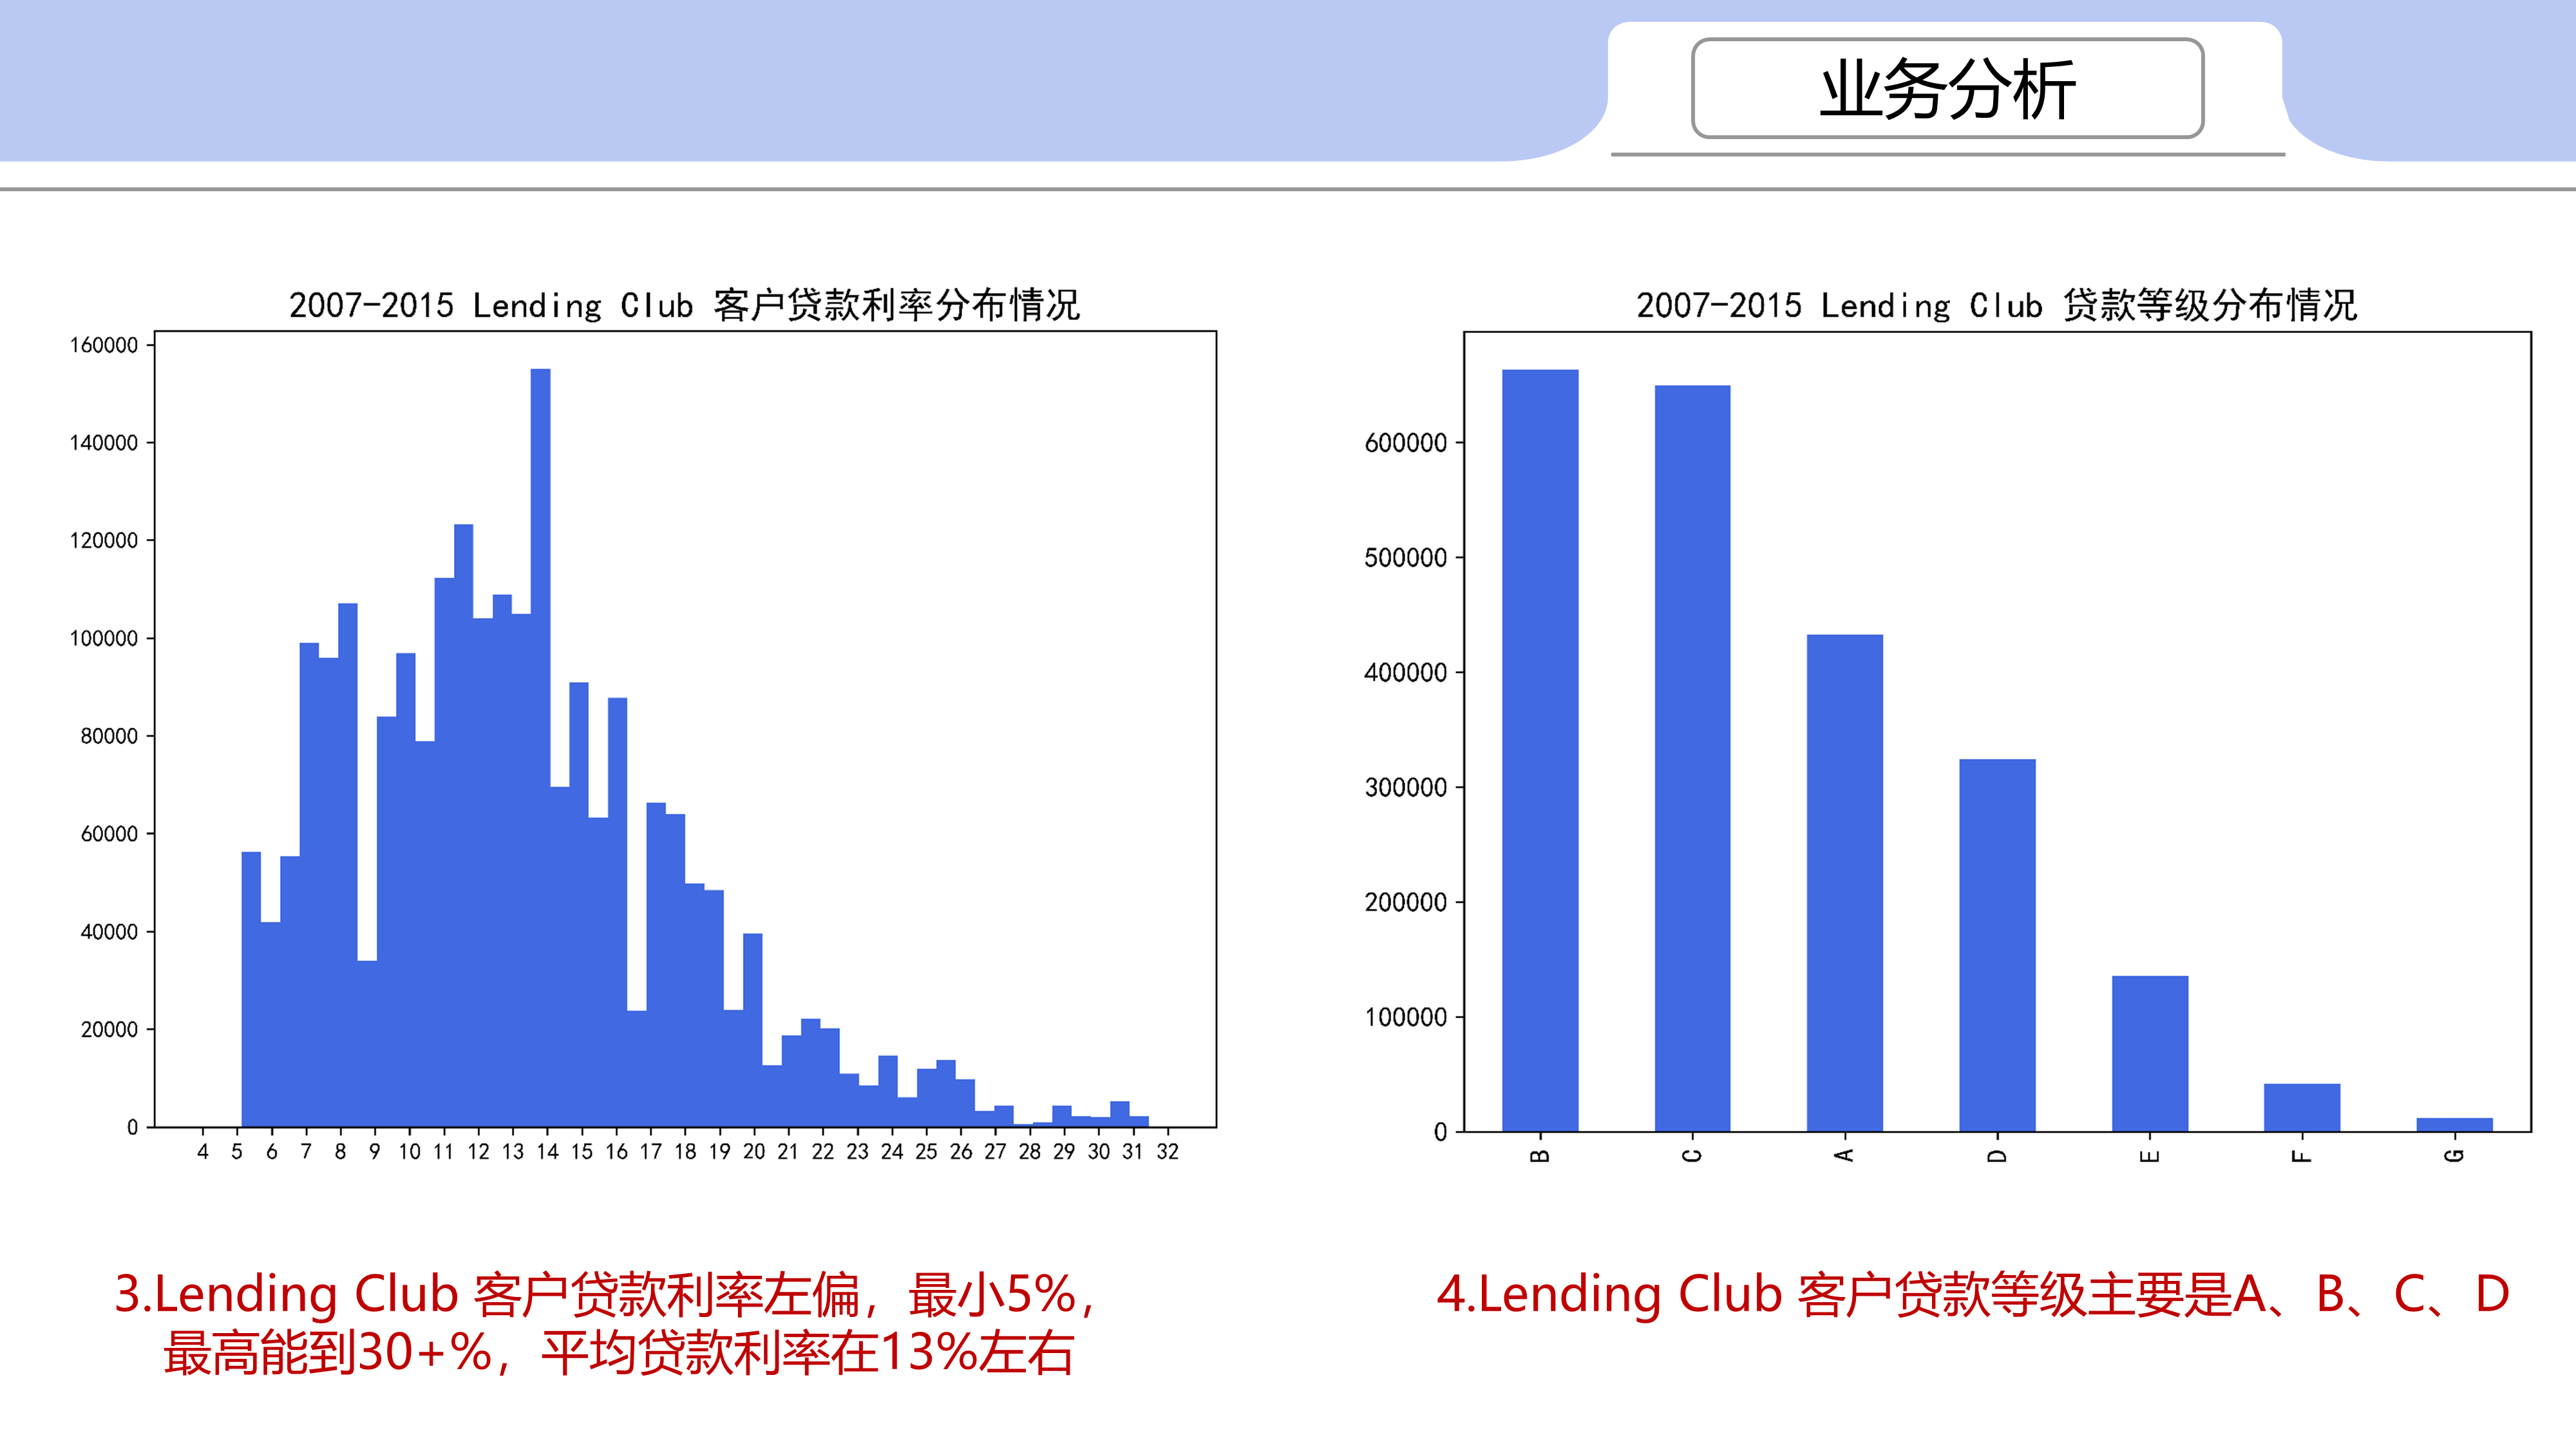
Lending Club 客户贷款利率左偏,最小5%,最高能到30+%,平均贷款利率在13%左右
-
Lending Club 客户贷款等级主要是A、B、C、D
-
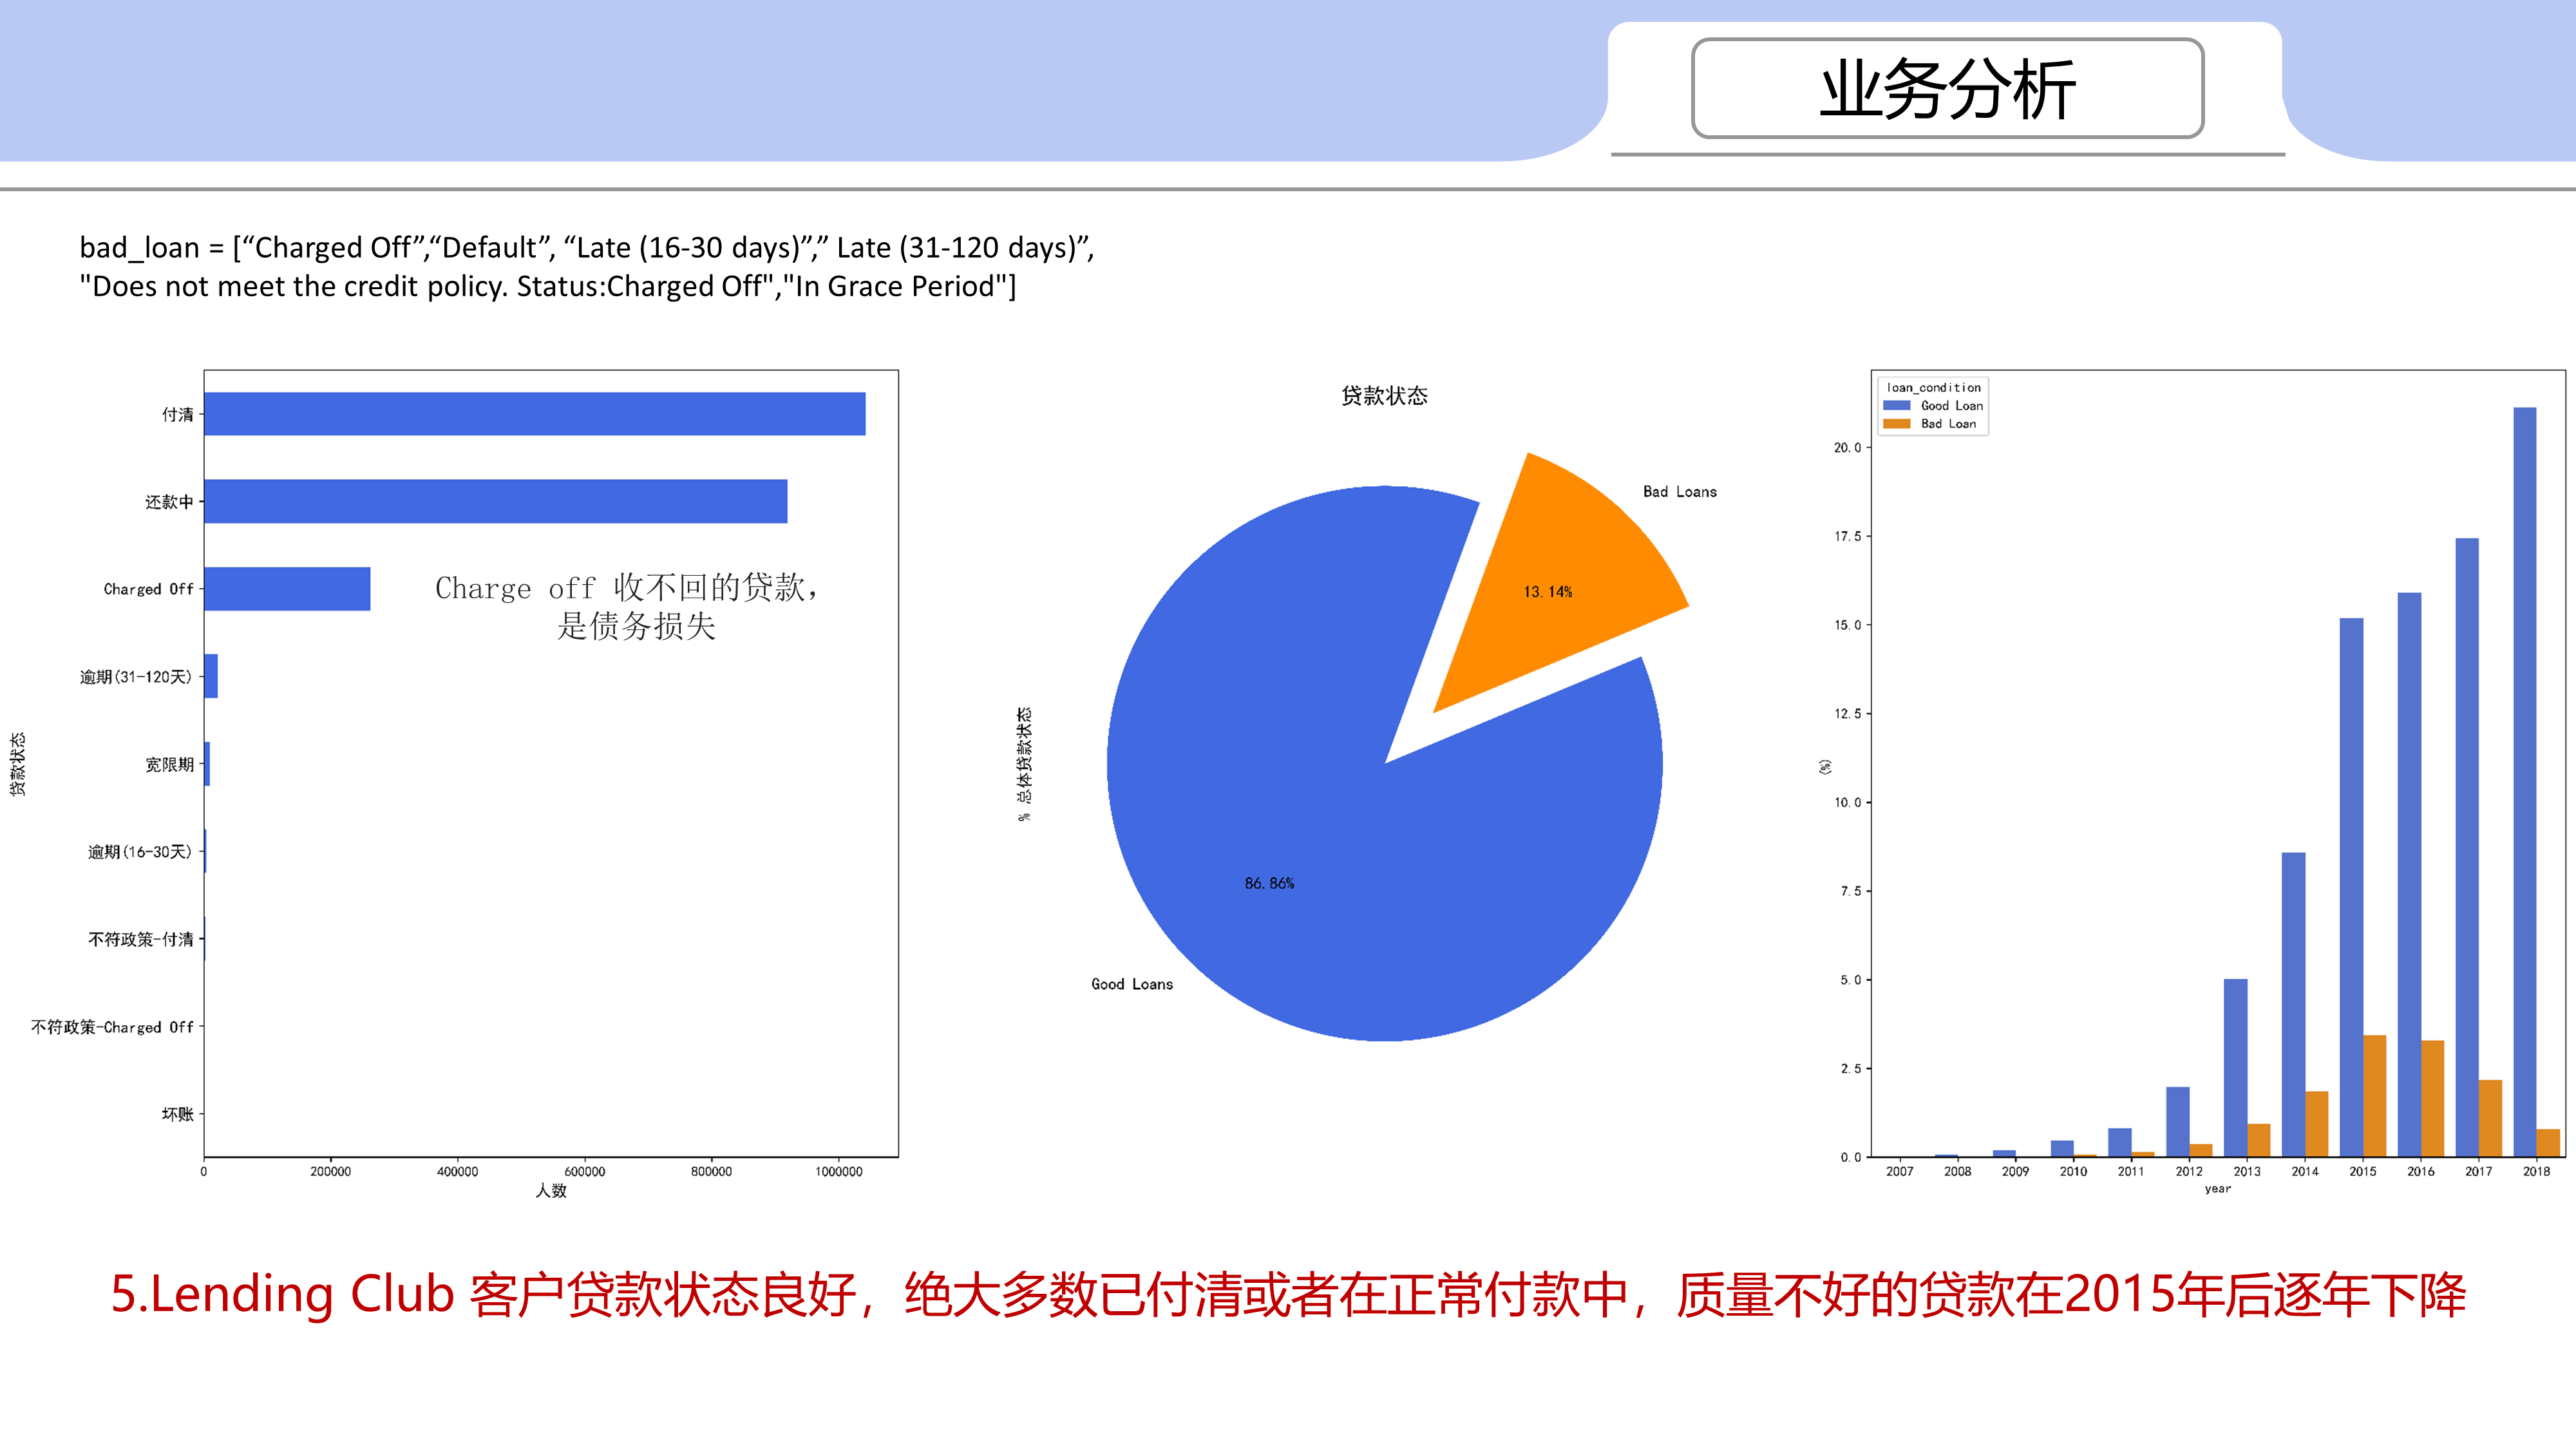
Lending Club 客户贷款状态良好,绝大多数已付清或者在正常付款中,质量不好的贷款在2015年后逐年下降
2.3 分析报告
附:
贷款状态说明:
-
Current 正常还贷中
-
Fully Paid 付清
-
Issued 发放
-
Charged Off 销账,已经收不回来的贷款
-
Late (31-120 days) 延期
-
Late (16-30 days) 延期
-
In Grace Period 宽限期
-
Does not meet the credit policy. Status:Charged Off 不符合信贷政策,销账
-
Does not meet the credit policy. Status:Fully Paid 不符合信贷政策,付清
-
Default 坏账
程序:
#coding:utf-8

import pandas as pd
import numpy as np
import time
import matplotlib.pyplot as plt
import seaborn as sns

plt.rcParams['font.sans-serif'] = ['SimHei']  # 用来正常显示中文标签
plt.rcParams['axes.unicode_minus'] = False    # 用来正常显示负号,#有中文出现的情况,需要u'内容'

start_time = time.process_time()

# # 读取数据
# loan = pd.read_csv('loan.csv',low_memory = False)
# df = loan[['issue_d','addr_state','emp_length', 'emp_title', 'annual_inc','home_ownership',
#          'pub_rec', 'dti','purpose',
#          'loan_amnt','funded_amnt','funded_amnt_inv','term', 'grade','int_rate','loan_status',
#          'tot_cur_bal','avg_cur_bal', 'total_acc', 'total_bc_limit',]].copy()
#
# # 将 ‘issue_d’ str形式的时间日期转换
# dt_series = pd.to_datetime(df['issue_d'])
# df['year'] = dt_series.dt.year
# df['month'] = dt_series.dt.month
#
# # 根据收入 'annual_inc' 定义收入“低、中、高”
# # <10万 --> low , 10万~20万 --> medium , >20 万 --> high
# df['income_category'] = np.nan
# lst = [df]
# for col in lst:
#     col.loc[col['annual_inc'] <= 100000, 'income_category'] = 'Low'
#     col.loc[(col['annual_inc'] > 100000) & (col['annual_inc'] <= 200000), 'income_category'] = 'Medium'
#     col.loc[col['annual_inc'] > 200000, 'income_category'] = 'High'
#
# # 根据贷款状态 ‘loan_status’ 定义好坏贷款
# bad_loan = ["Charged Off",
#             "Default",
#             "Does not meet the credit policy. Status:Charged Off",
#             "In Grace Period",
#             "Late (16-30 days)",
#             "Late (31-120 days)"]
# df['loan_condition'] = np.nan
#
# def loan_condition(status):
#     if status in bad_loan:
#         return 'Bad Loan'
#     else:
#         return 'Good Loan'
#
# df['loan_condition'] = df['loan_status'].apply(loan_condition)
# df['loan_condition_int'] = np.nan
# for col in lst:
#     col.loc[df['loan_condition'] == 'Good Loan', 'loan_condition_int'] = 0  # Negative (Bad Loan)
#     col.loc[df['loan_condition'] == 'Bad Loan', 'loan_condition_int'] = 1  # Positive (Good Loan)
# df['loan_condition_int'] = df['loan_condition_int'].astype(int)
#
# df.to_pickle("first_df.pkl")

# 数据查看

df = pd.read_pickle('first_df.pkl')
# print(df.head())
# print(df.info())
# print(df.describe())
# print(df.isna().sum())          # 检查空值情况


# # 1 客户画像
# # 1.1 地域分布
# fig1 = plt.figure()
# ax1 = fig1.add_subplot(111)
# df['addr_state'].value_counts()[0:19].plot(kind='bar',color="royalblue",fontsize=12)
# plt.title("2007-2015 Lending Club 客户地域分布情况",fontsize=16)
# plt.subplots_adjust(top=1,bottom=0,left=0,right=1,hspace=0,wspace=0)
# plt.savefig("1.1 2007-2015 Lending Club 客户地域分布情况.png",dpi=1000,bbox_inches = 'tight')#解决图片不清晰,不完整的问题
# # plt.show()
#
# # 1.2 工作年限分布
# fig2 = plt.figure()
# ax1 = fig2.add_subplot(111)
# df['emp_length'].value_counts().plot(kind='bar',color="royalblue",fontsize=12)
# plt.title("2007-2015 Lending Club 客户工作年龄分布情况",fontsize=16)
# plt.subplots_adjust(top=1,bottom=0,left=0,right=1,hspace=0,wspace=0)
# plt.savefig("1.2 2007-2015 Lending Club 客户工作年龄分布情况.png",dpi=1000,bbox_inches = 'tight')#解决图片不清晰,不完整的问题
# # plt.show()
#
# # 1.3 职业分布
# fig3 = plt.figure()
# ax1 = fig3.add_subplot(111)
# df['emp_title'].value_counts()[0:14][::-1].plot(kind='barh',color="royalblue",fontsize=12)
# plt.title("2007-2015 Lending Club 客户职业分布情况",fontsize=16)
# plt.subplots_adjust(top=1,bottom=0,left=0,right=1,hspace=0,wspace=0)
# plt.savefig("1.3 2007-2015 Lending Club 客户职业分布情况.png",dpi=1000,bbox_inches = 'tight')#解决图片不清晰,不完整的问题
# # plt.show()
#
# # 1.4 收入分布
# fig4 = plt.figure()
# ax1 = fig4.add_subplot(111)
# new_ticks=np.linspace(0,500000,11)
# plt.hist(df['annual_inc'].dropna(),range=(0,500000),bins=60,color="royalblue")
# plt.xticks(new_ticks)
# plt.title("2007-2015 Lending Club 客户年收入($)分布情况",fontsize=16)
# plt.subplots_adjust(top=1,bottom=0,left=0,right=1,hspace=0,wspace=0)
# plt.savefig("1.4 2007-2015 Lending Club 客户年收入($)分布情况.png",dpi=1000,bbox_inches = 'tight') # 解决图片不清晰,不完整的问题
# # plt.show()
#
# # 1.5 住房类型分布
# fig5 = plt.figure()
# ax1 = fig5.add_subplot(111)
# df['home_ownership'].replace({"MORTGAGE":"还贷","RENT":"租房","OWN":"自有住房","ANY":"其他","OTHER":"其他","NONE":"其他"},inplace=True)
# plt.pie(df['home_ownership'].dropna().value_counts(),labels=["还贷","租房","自有住房","其他"],autopct="%1.1f%%")
# plt.title("2007-2015 Lending Club 客户住房分布情况",fontsize=16)
# plt.subplots_adjust(top=1,bottom=0,left=0,right=1,hspace=0,wspace=0)
# plt.savefig("1.5 2007-2015 Lending Club 客户住房分布情况.png",dpi=1000,bbox_inches = 'tight') # 解决图片不清晰,不完整的问题
# # plt.show()
#
# # 1.6 贬损公共记录
# fig6 = plt.figure()
# ax1 = fig6.add_subplot(111)
# pub_v=df['pub_rec'].value_counts()
# x_ticks=list(range(6))
# pub_v[0:5].plot(kind='bar',color='royalblue',fontsize=12)
# plt.xticks(x_ticks,rotation=0)
# pub_p=pub_v/pub_v.sum()     # 计算所占百分比
# pub_p=pub_p.apply(lambda x:format(x,'.2%'))[0:5] # 转换百分比显示
# for i in x_ticks:
#     plt.text(i,pub_v[i]+1.2, pub_p[i], ha='center', va= 'bottom',fontsize=12)
# plt.title("1.6 2007-2015 Lending Club 贬损公共记录分布情况",fontsize=16)
# plt.subplots_adjust(top=1,bottom=0,left=0,right=1,hspace=0,wspace=0)
# plt.savefig("1.6 2007-2015 Lending Club 贬损公共记录分布情况.png",dpi=1000,bbox_inches = 'tight') # 解决图片不清晰,不完整的问题
# # plt.show()
#
# # 1.7 债务收入比
# fig7=plt.figure()
# ax1=fig7.add_subplot(111)
# new_ticks=np.linspace(-2,15,18)
# plt.hist(df['dti'][df['dti']<10].dropna(),range=(-2,15),bins=100,color="royalblue")
# plt.xticks(new_ticks)
# plt.title("2007-2015 Lending Club 客户每月债务/收入分布情况",fontsize=16)
# plt.subplots_adjust(top=1,bottom=0,left=0,right=1,hspace=0,wspace=0)
# plt.savefig("1.7 2007-2015 Lending Club 客户每月 债务-收入比分布情况.png",dpi=1000,bbox_inches = 'tight')#解决图片不清晰,不完整的问题
# # plt.show()
#
#
# # 1.8 贷款目的
# fig8 = plt.figure()
# ax1 = fig8.add_subplot(111)
# df['purpose'].value_counts(ascending=True).plot(kind='barh',fontsize=12,color="royalblue")
# plt.title("2007-2015 Lending Club 贷款目的分布情况",fontsize=16)
# plt.subplots_adjust(top=1,bottom=0,left=0,right=1,hspace=0,wspace=0)
# plt.savefig("1.8 2007-2015 Lending Club 贷款目的分布情况.png",dpi=1000,bbox_inches = 'tight')#解决图片不清晰,不完整的问题
# plt.show()

#
#
# # 2 业务分析
# # 2.1 贷款额(总&平均)
# fig1, ax = plt.subplots(1, 3, figsize=(16,5))
# loan_amount = df["loan_amnt"].values
# funded_amount = df["funded_amnt"].values
# investor_funds = df["funded_amnt_inv"].values
#
# sns.distplot(loan_amount, ax=ax[0], color="royalblue")
# ax[0].set_title("借款人申请的借款额", fontsize=16)
# sns.distplot(funded_amount, ax=ax[1], color="darkorange")
# ax[1].set_title("公司提供的贷款额", fontsize=16)
# sns.distplot(investor_funds, ax=ax[2], color="darkcyan")
# ax[2].set_title("当前贷款中投资人提供的贷款额", fontsize=16)
# plt.subplots_adjust(top=1,bottom=0,left=0,right=1,hspace=0.2,wspace=0.2)
# plt.savefig("2.1 2007-2015 Lending Club 贷款情况了解.png",dpi=1000,bbox_inches = 'tight')#解决图片不清晰,不完整的问题
# # plt.show()

# # 每年贷款增长率
# df_g = df[['year','loan_amnt']].groupby(['year']).sum().reset_index()
# df_g = df_g.rename(columns={'loan_amnt':'loan_amnt_sum'})
# df_g['loan_amnt_pro'] = -df_g['loan_amnt_sum'].diff(-1)/df_g.iloc[:,1]*100
#
# fig11 = plt.figure(figsize=(8,8))
# plt.title("每年贷款请求额总和 & 增长率",fontsize=20)
# plt.bar(df_g.iloc[:,0],df_g.iloc[:,1],color="royalblue")
# plt.ylabel("贷款额总和",fontsize=16)
# plt.xticks(df_g.iloc[:,0])
# plt.twinx()
# plt.plot(df_g.iloc[1:,0],df_g.iloc[:-1,2],color="darkorange")
# plt.ylabel("增长率 (%)",fontsize=16)
# plt.subplots_adjust(top=1,bottom=0,left=0,right=1,hspace=0.2,wspace=0.2)
# plt.savefig("2.11 2007-2015 Lending Club 每年贷款请求额总和&增长率.png",dpi=1000,bbox_inches = 'tight')#解决图片不清晰,不完整的问题
# # plt.show()

# # 2.2 贷款人数
# fig2,ax=plt.subplots(1,2,figsize=(12,5))
# sns.barplot('year', 'loan_amnt', data=df[['year','loan_amnt']],ax=ax[0])
# ax[0].set_title('每年申请贷款额度', fontsize=16)
# ax[0].set_ylabel("平均额度",fontsize=12)
# sns.countplot('year',data=df[['year','loan_amnt']],ax=ax[1])
# ax[1].set_title('每年申请贷款人数', fontsize=16)
# ax[1].set_ylabel("申请人数",fontsize=12)
# plt.subplots_adjust(top=1,bottom=0,left=0,right=1,hspace=0.2,wspace=0.2)
# plt.savefig("2.2 2007-2015 Lending Club 每年申请贷款平均额和申请贷款人数.png",dpi=1000,bbox_inches = 'tight')#解决图片不清晰,不完整的问题
# # plt.show()
#
#
# # 2.3 贷款期限
# fig3 = plt.figure()
# colors = ['royalblue','darkorange']
# df['term'].value_counts().plot(kind='pie',explode=(0.05,0),autopct="%1.1f%%",colors=colors,fontsize=12)
# plt.title("2007-2015 Lending Club 贷款期限分布",fontsize=16)
# plt.subplots_adjust(top=1,bottom=0,left=0,right=1,hspace=0.2,wspace=0.2)
# plt.savefig("2.3 2007-2015 Lending Club 贷款期限分布.png",dpi=1000,bbox_inches = 'tight')#解决图片不清晰,不完整的问题
# # plt.show()
#
# # 2.4 贷款等级 grade
# fig4 = plt.figure()
# ax1 = fig4.add_subplot(111)
# df['grade'].value_counts().plot(kind='bar',color="royalblue",fontsize=12)
# plt.title("2007-2015 Lending Club 贷款等级分布情况",fontsize=16)
# plt.subplots_adjust(top=1,bottom=0,left=0,right=1,hspace=0,wspace=0)
# plt.savefig("2.4 2007-2015 Lending Club 贷款等级分布分布情况.png",dpi=1000,bbox_inches = 'tight')#解决图片不清晰,不完整的问题
# # plt.show()
#
# # 2.5 贷款利率 int_rate
# fig5 = plt.figure()
# ax1 = fig5.add_subplot(111)
# new_ticks=np.linspace(4,32,29)
# plt.hist(df['int_rate'],range=(4,32),bins=50,color="royalblue")
# plt.xticks(new_ticks)
# plt.title("2007-2015 Lending Club 客户贷款利率分布情况",fontsize=16)
# plt.subplots_adjust(top=1,bottom=0,left=0,right=1,hspace=0,wspace=0)
# plt.savefig("2.5 2007-2015 Lending Club 客户贷款利率分布情况.png",dpi=1000,bbox_inches = 'tight')#解决图片不清晰,不完整的问题
# # plt.show()
#
#
# # 2.6 贷款状态 loan_status
# fig6, ax = plt.subplots(1,3, figsize=(24,8))
# colors = ["royalblue", "darkorange"]
# statu_labels = ['付清' ,'还款中' ,'Charged Off',
#                 '逾期(31-120天)' ,'宽限期' ,'逾期(16-30天)' ,
#                 '不符政策-付清','不符政策-Charged Off','坏账']
# labels =["Good Loans", "Bad Loans"]
# print(df['loan_status'].unique())
# plt.suptitle('贷款状态', fontsize=16)
#
# df["loan_status"].value_counts()[::-1].plot(kind='barh',color='royalblue',ax=ax[0])
# ax[0].set_xlabel('人数',fontsize=12)
# ax[0].set_ylabel('贷款状态',fontsize=12)
# ax[0].set_yticklabels(statu_labels[::-1
#                       ],fontsize=12)
#
# df["loan_condition"].value_counts().plot.pie(explode=[0,0.25], autopct='%1.2f%%', ax=ax[1], shadow=False, colors=colors,
#                                              labels=labels, fontsize=12, startangle=70)
# ax[1].set_ylabel('% 总体贷款状态', fontsize=12)
#
# sns.barplot(x="year", y="loan_amnt", hue="loan_condition", data=df, palette=colors,ax=ax[2], estimator=lambda x: len(x) / len(df['year']) * 100)
# ax[2].set(ylabel="(%)")
# plt.subplots_adjust(top=1,bottom=0,left=0,right=1,hspace=0.2,wspace=0.2)
# plt.savefig("2.6 2007-2015 Lending Club 贷款状态分布.png",dpi=1000,bbox_inches = 'tight') #解决图片不清晰,不完整的问题
# # plt.show()


end_time = time.process_time()
print("程序运行了 %s 秒"%(end_time-start_time))

