机器学习实战1-K均值
本例来源于github项目:https://github.com/jakevdp/sklearn_pycon2015/blob/master/notebooks/04.2-Clustering-KMeans.ipynb
算法说明:
K-means算法是一种无监督聚类算法,即在没有标签的数据集中找出同类。k-means算法是一种简单的迭代型聚类算法,采用距离作为相似性指标,从而发现给定数据集中的K个类,且每个类的中心是根据类中所有值的均值得到,每个类用聚类中心来描述。对于给定的一个包含n个d维数据点的数据集X以及要分得的类别K,选取欧式距离作为相似度指标,聚类目标是使得各类的聚类平方和最小,即最小化:

结合最小二乘法和拉格朗日原理,聚类中心为对应类别中各数据点的平均值,同时为了使得算法收敛,在迭代过程中,应使最终的聚类中心尽可能的不变。
算法步骤:
-
选取数据空间中的K个对象作为初始中心,每个对象代表一个聚类中心;
-
对于样本中的数据对象,根据它们与这些聚类中心的欧氏距离,按距离最近的准则将它们分到距离它们最近的聚类中心(最相似)所对应的类;
-
更新聚类中心:将每个类别中所有对象所对应的均值作为该类别的聚类中心,计算目标函数的值;
-
判断聚类中心和目标函数的值是否发生改变,若不变,则输出结果,若改变,则返回。
1. 初体验
import numpy as np
import matplotlib.pyplot as plt
from scipy import stats
import seaborn as sns
from sklearn.datasets.samples_generator import make_blobs
from sklearn.cluster import KMeans

# 1. 利用本身自带库进行数据准备
sns.set()
x,y=make_blobs(n_samples=300,centers=4,random_state=0,cluster_std=0.6)
# plt.scatter(x[:,0],x[:,1],s=50)
# plt.show()

# 2. 利用sklearn中的kmeans进行聚类
est=KMeans(4)
est.fit(x)
y_kmeans=est.predict(x)
plt.scatter(x[:,0],x[:,1],c=y_kmeans,s=50,cmap='rainbow')
plt.show()
输出结果:
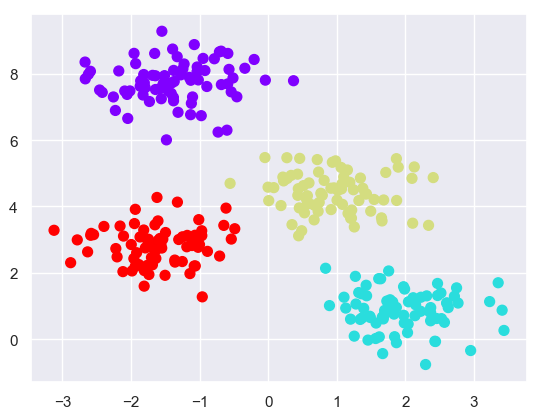
注意:
-
该算法的收敛性不保证,因此,scikit-learn默认使用大量随机初始化并找到最佳结果。
-
必须先设置簇的数量,还有其他算法能解决这个问题。
2. K-means在数字中的应用
中心思想:给定一张满是手写数字的图片,sklearn中已经给出各种类型数据、标签等,利用K-means对其进行聚类,并检查准确率。
2.1 数据集导入
import numpy as np
import matplotlib.pyplot as plt
from scipy import stats
import seaborn as sns
from sklearn.cluster import KMeans
from sklearn.datasets import load_digits

digits=load_digits()
# 1.查看数据集属性
print(digits.keys())
print(digits.images[0])
print(digits.data[0].reshape(8,8))
for i in range(20):
    ax = plt.subplot(5, 4, 1 + i, xticks=[], yticks=[])
    ax.imshow(digits.data[i].reshape(8,8),cmap=plt.cm.binary)
plt.show()
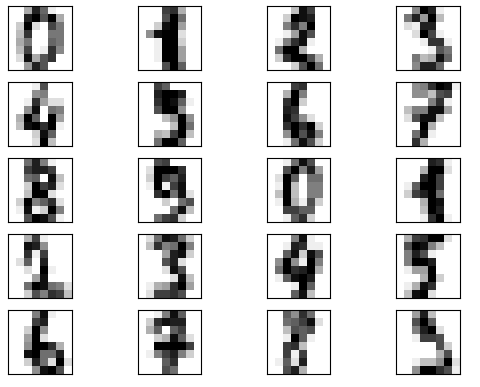
查看前20(总1797个样本)个手写图片如下:
2.2 聚类
解析:本例程序使用digits.data数据,其为1797*64数组,其中每个一维数组(64)保存的是灰度值,将其转换为8*8的二维数组,显示出的则是手写数字。本例对1797个数据簇进行聚类,最后得到十个中心簇,显示为0~9不同数字,程序如下。
import numpy as np
import matplotlib.pyplot as plt
from scipy import stats
import seaborn as sns
from sklearn.cluster import KMeans
from sklearn.datasets import load_digits

digits=load_digits()
# 2. 聚类
est=KMeans(n_clusters=10)
clusters=est.fit_predict(digits.data)
print(est.cluster_centers_.shape)
fig=plt.figure(figsize=(8,3))
for i in range(10):
    ax=fig.add_subplot(2,5,1+i,xticks=[],yticks=[])
    ax.imshow(est.cluster_centers_[i].reshape((8,8)),cmap=plt.cm.binary)
plt.show()
输出结果:
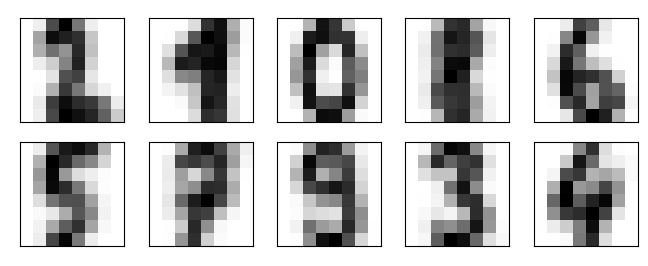
我们可以看见即使没有标签,K-means也能识别出
2.3 修订标签
from scipy.stats import mode
# 3.修订每个簇中标签与实际情况不同的数
labels=np.zeros_like(clusters)
print(len(labels))
for i in range(10):
    mask=(clusters==i)
    labels[mask]=mode(digits.target[mask])[0]#mode 取众数
2.4 PCA可视化
PCA:主成分分析法
from sklearn.decomposition import PCA
from sklearn.metrics import accuracy_score

# 4.PCA可视化
X=PCA(2).fit_transform(digits.data)#将多维数据降成二维可视化
kwargs=dict(cmap=plt.cm.get_cmap('rainbow',10),
            edgecolor='none',alpha=0.6)
fig, ax = plt.subplots(1, 2, figsize=(8, 4))
ax[0].scatter(X[:, 0], X[:, 1], c=labels, **kwargs)
ax[0].set_title('learned cluster labels')
ax[1].scatter(X[:, 0], X[:, 1], c=digits.target, **kwargs)
ax[1].set_title('true labels')
plt.show()
print(accuracy_score(digits.target, labels))
输出结果:
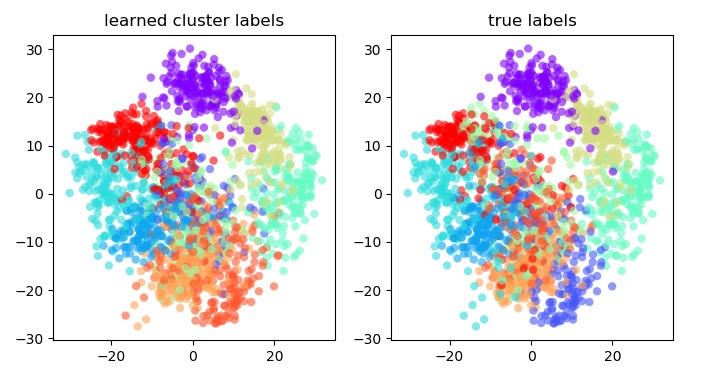
正确率:0.7952142459654981
2.5 混淆矩阵
利用混淆矩阵,对预测进行分析,观察一下哪个值最容易出错。
from sklearn.metrics import confusion_matrix

# 5.混淆矩阵分析
print(confusion_matrix(digits.target,labels))
plt.imshow(confusion_matrix(digits.target,labels),cmap='Blues',interpolation='nearest')
plt.colorbar()
plt.grid(False)
plt.ylabel('true')
plt.xlabel('predicted')
plt.show()
输出结果:
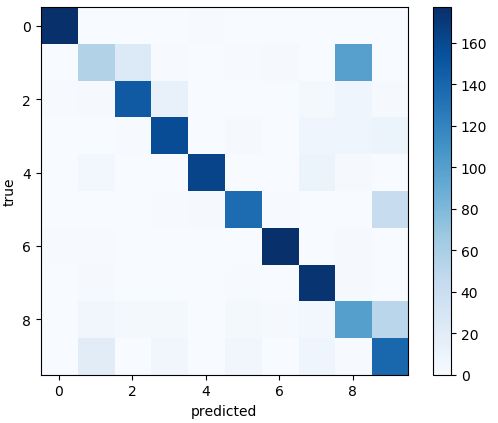
图中可明显看出1和8的正确率最低,最易混淆。
3. K-means色彩压缩的应用
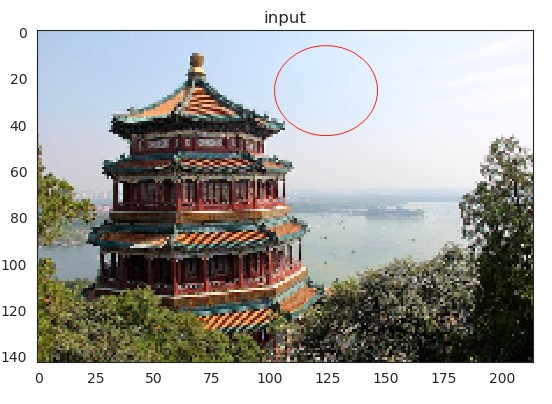
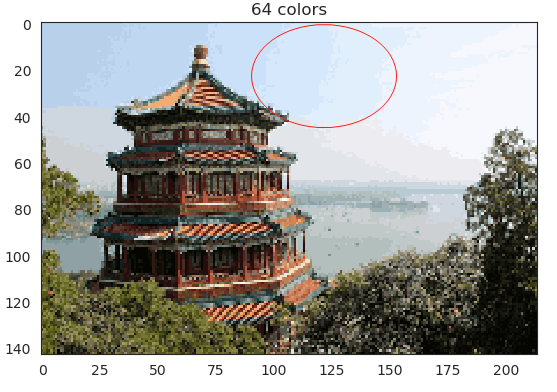
聚类的一个有趣应用是彩色图像压缩。例如,假设您有一个包含数百万种颜色的图像。在大多数图像中,大量的颜色将被使用,相反,大量的像素将具有相似或相同的颜色。
本例中心思想:将很多种的RGB值缩减为64种,相近的RGB值聚合成簇,进而达到压缩目的。
3.1 导入图像
import matplotlib.pyplot as plt
from sklearn.datasets import load_sample_image

# 1.导入图片
china=load_sample_image("china.jpg")
plt.imshow(china)
plt.show()
print(china.shape)
输出结果:(427, 640, 3)
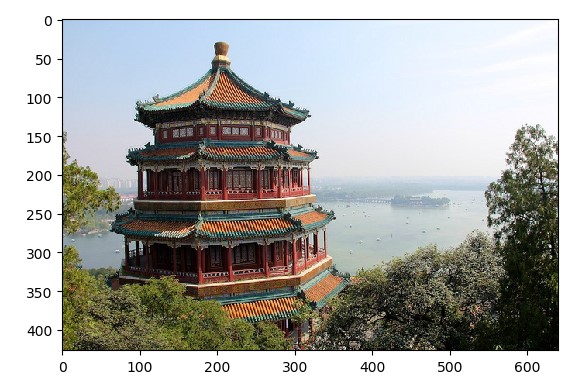
我们可以将此图像设想为三维色彩(RGB)空间中的点云。我们将重新缩放颜色,使它们介于0和1之间,然后将数组重新整形为典型的scikit-learn输入。
3.2 压缩图像
from sklearn.cluster import KMeans
import seaborn as sns
import numpy as np

# 2.压缩图像
image=china[::3,::3] # 这里的3指步长,每个三个数取一次,减少运算量,同时也是压缩图片的一个操作
# print(image.shape)
x=(image/255.0).reshape(-1,3) # 3列,未知行数
n_colors=64 # 图片的颜色种类为64种

model = KMeans(n_colors) # k-means算法
labels = model.fit_predict(x) # 将图片数据分为64簇,用labels存放(0-63 64个标签号)
colors = model.cluster_centers_ # colors存放64簇的64个中心值(颜色值)
new_image = colors[labels].reshape(image.shape) # 将每个打上标签的重新赋予与标签对应的中心值,并还原成原数组形态
new_image = (255 * new_image).astype(np.uint8) # 恢复0-255的rgb表示方式

with sns.axes_style('white'): # 对比两张图片显示
    plt.figure()
    plt.imshow(image)
    plt.title('input')
    plt.figure()
    plt.imshow(new_image)
    plt.title('{0} colors'.format(n_colors))
plt.show()
