3维度图形
Python三维绘图--Matplotlib; 设置color bar
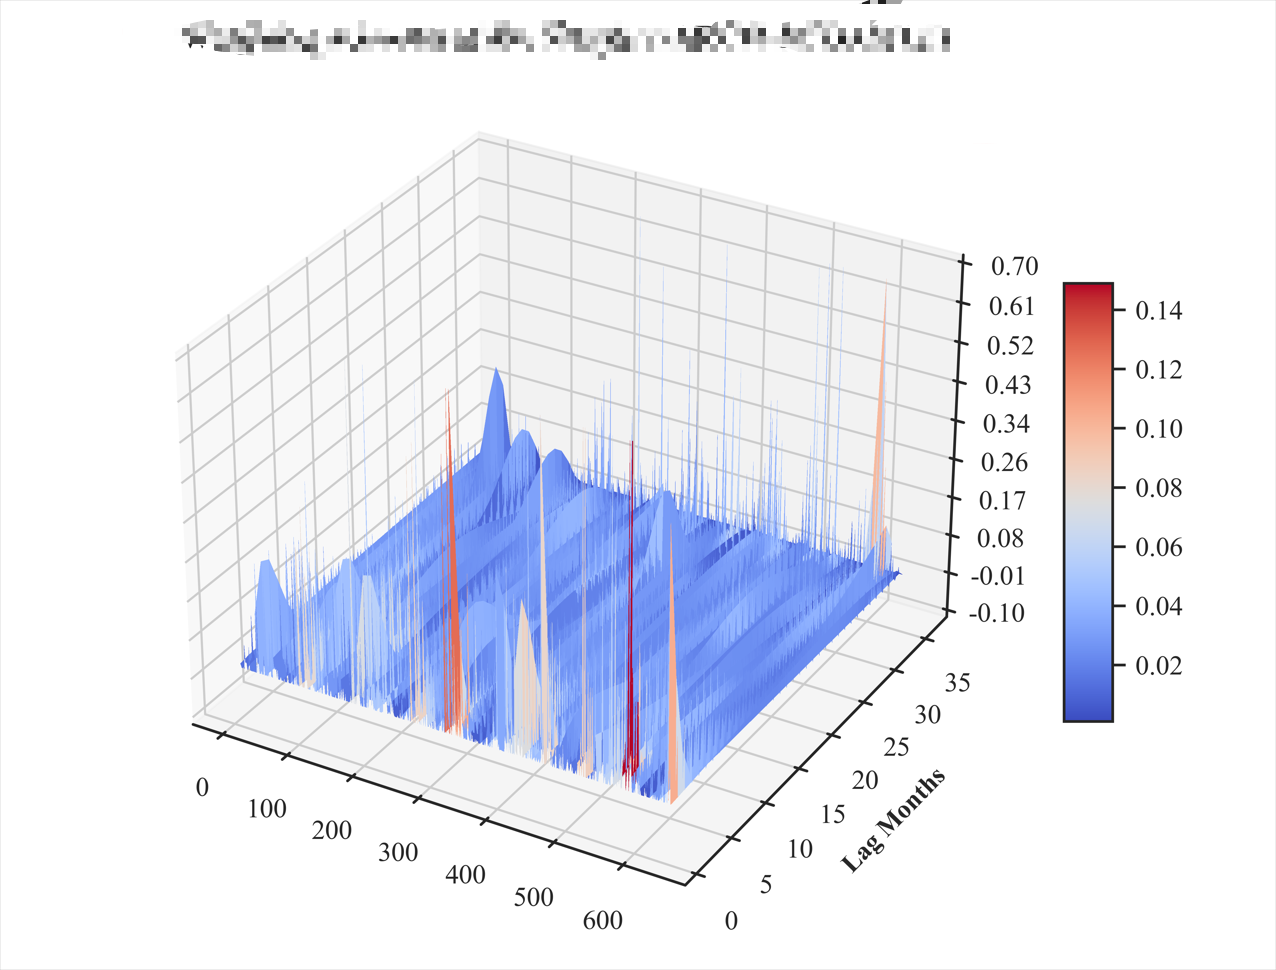
from matplotlib import cm
from matplotlib.ticker import LinearLocator, FormatStrFormatter
import matplotlib.gridspec as gridspec

plt.rcParams['font.family'] = 'Times New Roman'
plt.rcParams['font.size'] = 10
fig = plt.figure(figsize=(6.5, 8 * 0.618))
ax = fig.add_subplot(projection='3d')
plt.subplots_adjust(left=0.125, right=0.9, top=0.935, bottom=0.110)
X, Y = np.meshgrid(x, y)
surf = ax.plot_surface(X, Y, beta_weight, cmap=cm.coolwarm,
                       linewidth=0, antialiased=False)

ax.set_zlim(-0.1, 0.7)
ax.zaxis.set_major_locator(LinearLocator(10))
ax.zaxis.set_major_formatter(FormatStrFormatter('%.02f'))

# cset = ax.contourf(X, Y, beta_weight, zdir='z', offset=-0.5, cmap=cm.coolwarm)
# ax.set_xlabel('X')
ax.set_ylabel('Lag Months', weight='bold')
# ax.set_zlabel('Z')

title_sup = 'W'
ax.set_title(title_sup, weight='bold', fontsize=12)
# Add a color bar which maps values to colors.
cb = fig.colorbar(surf, shrink=0.5, aspect=9)
# cb.set_label('colorbar', fontsize=10)
cb.ax.tick_params(labelsize=10)
for size in ax.get_xticklabels():  # 获取x轴上所有坐标,并设置字号
    size.set_fontname('Times New Roman')
for size in ax.get_yticklabels():  # 获取x轴上所有坐标,并设置字号
    size.set_fontname('Times New Roman')
for size in ax.get_zticklabels():  # 获取x轴上所有坐标,并设置字号
    size.set_fontname('Times New Roman')
plt.tick_params(axis='both', which='major', labelsize=10)
plt.tight_layout()
# plt.show(block=True)
plt.savefig('./figures/t.png', dpi=800)
plt.close()

 浙公网安备 33010602011771号