热力图
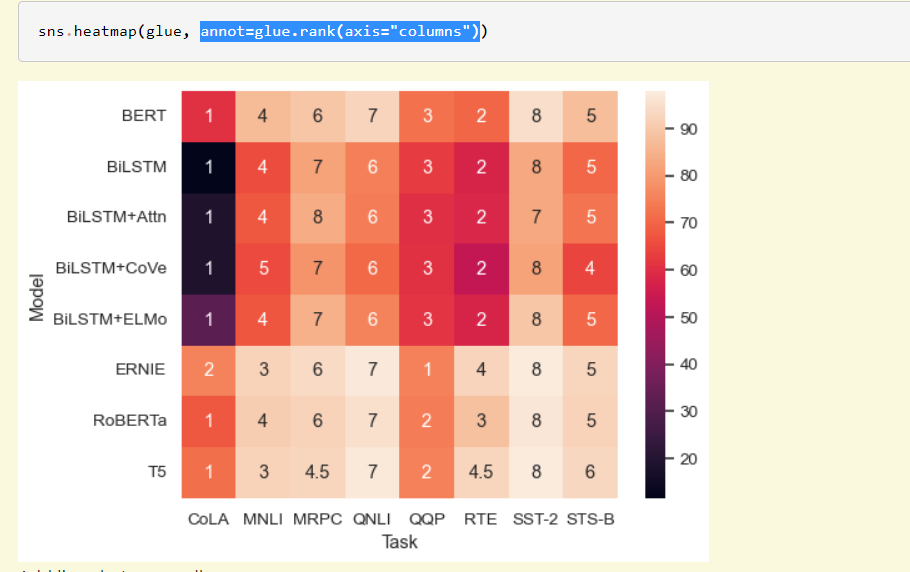
官方:seaborn.heatmap,在官方给的例子中如何去添加方格中的文字:
annot可以定义为与绘制热力图data相同shape的数据,用mask进行过滤,即表示为空白。
annot=glue.rank(axis="columns")

如果自定义标签:如何在Python Seaborn Heatmap中添加文本加值; Seaborn heatmap中自定义文本标签内容
demo
细节包括 label、ticker、刻度

可以直接使用df.columns 指定 热力图的 xticker,
annot=False 不填充数字, mask 设置空白
ax = plt.subplot(3, 1, 3)
pm_ht_differ = np.where((pm_ht_differ < 1) & (pm_ht_differ > -1), 0, py_ht_differ)
ax = sns.heatmap(pm_ht_differ.T, mask=pm_ht_differ.T == 0, ax=ax, cmap='RdBu', annot=False, yticklabels='auto')
plt.yticks(rotation=15, fontsize=9, verticalalignment='baseline', fontweight='light')

replace_ticker = pd.to_datetime(ret.index).strftime('%Y-%m')  # 转化为年月
plt.xticks(range(0, py_ht_differ.shape[0]), replace_ticker,
           rotation=15, fontsize=8, verticalalignment='baseline', fontweight='light')
plt.tick_params(bottom=False, labelbottom=True)  # 底部刻度、label
ticker_spacing = 240  # 解决x密集
ax.xaxis.set_major_locator(ticker.MultipleLocator(ticker_spacing))

cbar = ax.collections[0].colorbar  # 设置cbar字体
cbar.ax.tick_params(labelsize=9)
plt.title('Step1: Difference of $H_t$', weight='bold')
sns.set_theme(font='Times New Roman')
fig, ax = plt.subplots(1, 1, figsize=(10, 6))
ax = sns.heatmap(np.log(pm_ht_differ.T), # mask=pm_ht_differ.T == 0,  vmin=-100, vmax=100,
                 ax=ax, cmap='RdBu', annot=False, yticklabels='auto')

# replace ticker, num to time, range 240
replace_ticker = pd.to_datetime(ret.index).strftime('%Y-%m')
plt.xticks(range(0, pm_ht_differ.shape[0]), replace_ticker,
           rotation=15, fontsize=10, fontweight='light')

ticker_spacing = 240
ax.xaxis.set_major_locator(ticker.MultipleLocator(ticker_spacing))

# color bar set
cbar = ax.collections[0].colorbar
cbar.ax.tick_params(labelsize=10)

# fig set
plt.yticks(rotation=15, fontsize=10, verticalalignment='baseline', fontweight='light')
plt.tick_params(bottom=False, labelbottom=True, left=True)  # 底部刻度、label
plt.ylabel('Stock', weight='bold')
plt.title(r'S', weight='bold')
fig.tight_layout()
plt.show(block=True)
ticklabel 字体设置 , 包括 cbar字体
cbar = ax.collections[0].colorbar
for size in ax.get_xticklabels():  # 获取x轴上所有坐标,并设置字号
    size.set_fontname('Times New Roman')
for size in ax.get_yticklabels():  # 获取x轴上所有坐标,并设置字号
    size.set_fontname('Times New Roman')
for l in cbar.ax.yaxis.get_ticklabels():
    l.set_family('Times New Roman')
plt.title('Long Correlation Term $C$', weight='bold', fontfamily='Times New Roman')  # title 字体设置
REF
Matplotlib画图的复杂颜色设置(包括fig, ax, spines, tick); ylabel 距离
热力图的细节还是很多的, 一些比较好的例子:
- seaborn—sns.heatmap绘制热力图, 包括使用 nlargets 绘制热力图,

 浙公网安备 33010602011771号