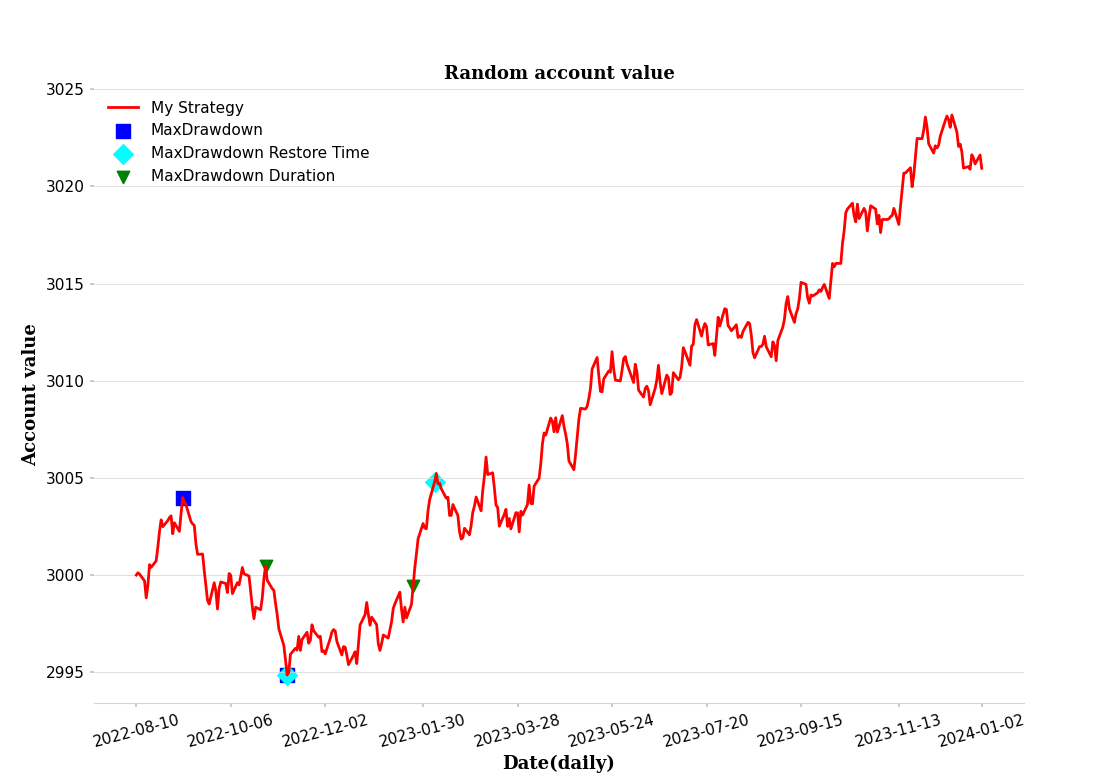
matplot 绘图 最大回撤
修改了一位大佬的blog,找不到出处了,最终效果:
import datetime
import matplotlib.pyplot as plt
import matplotlib.dates as mdate
import numpy as np
import random
import pandas as pd

DAYS = 365
random.seed(2022)


def Init():
    """ 初始化设置 """
    startdate = datetime.date.today()
    xdate = pd.date_range(startdate, periods=DAYS, freq='B')
    ycapital = [3000]

    for _ in range(DAYS - 1):
        ycapital.append(ycapital[-1] + random.uniform(-1, 1.1))
    return xdate, ycapital


def cal_maxdrawdown(df_stock, ori_column='price', dd_column='returns'):
    """ Calculate the MaxDrawdown """
    df_stock = cal_drawdown(df_stock, column=ori_column)
    MaxDrawdown = np.max(df_stock.loc[:, 'drawdown'])
    end_idx = np.argmax(df_stock.loc[:, 'drawdown'])
    start_idx = np.argmax(df_stock[ori_column].values[:end_idx])
    return MaxDrawdown, end_idx, start_idx


def max_drawdown(ycapital):
    """ Calculate the MaxDrawdown """
    # 计算每日的回撤
    drawdown = []
    tmp_max_capital = ycapital[0]
    for c in ycapital:
        tmp_max_capital = max(c, tmp_max_capital)
        drawdown.append(1 - c / tmp_max_capital)

    MaxDrawdown = max(drawdown)  # 最大回撤
    endidx = np.argmax(drawdown)  # 计算最大回撤日期范围
    startidx = np.argmax(ycapital[:endidx])  # enddate = xdate[endidx]

    # startdate = xdate[startidx]
    # 仅仅画图的话,我们只要索引值更加方便
    return MaxDrawdown, startidx, endidx


def max_drawdown_duration(ycapital):
    duration = []
    tmp_max_capital = ycapital[0]

    for c in ycapital:
        if c >= tmp_max_capital:
            duration.append(0)
        else:
            duration.append(duration[-1] + 1)

    # tmp_max_capital = max(c, tmp_max_capital)
    MaxDDD = max(duration)
    endidx = np.argmax(duration)
    startidx = endidx - MaxDDD
    return MaxDDD, startidx, endidx


def max_drawdown_restore_time(startidx, endidx, xdate, ycapital):
    """
    startidx:表示最大回撤的开始时间在 xdate 中的索引,由 max_drawdown 方法返回
    endidx:表示最大回撤的结束时间在 xdate 中的索引,由 max_drawdown 方法返回
    """
    maxdd_resore_time = 0
    restore_endidx = np.inf
    for t in range(endidx, len(xdate)):
        if ycapital[t] >= ycapital[startidx]:
            restore_endidx = t
            break
        else:
            maxdd_resore_time += 1
            restore_endidx = min(restore_endidx, len(xdate) - 1)
    return maxdd_resore_time, restore_endidx


def set_spline(ax, label: str = 'lightgray'):
    """ 设置边框 """
    ax.spines['top'].set_visible(False)  # 去掉边框 top
    ax.spines['left'].set_visible(False)
    ax.spines['right'].set_visible(False)
    ax.spines['bottom'].set_color(label)  # 设置 x 轴颜色


def set_sizes(font_size: int = 10):
    """
    set fonts for plt
    https://matplotlib.org/2.0.2/api/pyplot_api.html?highlight=rc#matplotlib.pyplot.rc
    :param fig_size: figure size
    :param font_tsize: figure title size
    :param font_size: font size
    :return:
    """
    # Set the default text font size, weight='bold'
    plt.rc('font', size=font_size)
    plt.rc('xtick', labelsize=font_size)
    plt.rc('ytick', labelsize=font_size)
    plt.rc('axes', labelsize=font_size)
    plt.rc('axes', titlesize=font_size)
    plt.rc('legend', fontsize=font_size)


def set_lable(label_dict, fontdict, bold=True):
    """ 设置 label 标签"""
    if bold:
        plt.title(label_dict["title"], fontdict=fontdict, weight='bold')
        plt.xlabel(label_dict["xlabel"], fontdict=fontdict, weight='bold')
        plt.ylabel(label_dict["ylabel"], fontdict=fontdict, weight='bold')
    else:
        plt.title("random account value", fontdict=fontdict)  # or plt.suptitle
        plt.xlabel("date(day)", fontdict=fontdict)
        plt.ylabel("account value", fontdict=fontdict)


def set_xtick_cut(ax, format: str = '%Y-%m-%d', cut: int = 9):
    """ 将xtick切分成多等分 """
    ax.xaxis.set_major_formatter(mdate.DateFormatter(format))  # 设置时间标签显示格式
    delta = round(len(xdate) / cut)  # 分成 (cut+1) 份
    plt.xticks([xdate[i * delta] for i in range(cut)] + [xdate[-1]])


def plot(xdate, ycapital, df_stock):
    set_sizes(font_size=11)
    # plt.style.use('seaborn-whitegrid')
    fig, ax = plt.subplots(figsize=(12, 8))

    plt.plot(xdate, ycapital, 'red', label='My Strategy', linewidth=2)
    MaxDrawdown, startidx, endidx = max_drawdown(ycapital)
    # MaxDrawdown, startidx, endidx = cal_maxdrawdown(df_stock, ori_column='price', dd_column='returns')
    print("最大回撤为:", MaxDrawdown)
    plt.scatter([xdate[startidx], xdate[endidx]], [ycapital[startidx], ycapital[endidx]],
                s=100, c='b', marker='s', label='MaxDrawdown')

    maxdd_resore_time, restore_endidx = max_drawdown_restore_time(startidx, endidx, xdate, ycapital)
    print("最大回撤恢复时间为(天):", maxdd_resore_time)
    plt.scatter([xdate[endidx], xdate[restore_endidx]], [ycapital[endidx], ycapital[restore_endidx]],
                s=100, c='cyan', marker='D', label='MaxDrawdown Restore Time')

    # 绘制最大回撤持续期标识 marker = 'D'
    MaxDDD, startidx, endidx = max_drawdown_duration(ycapital)
    print("最大回撤持续期为(天):", MaxDDD)
    plt.scatter([xdate[startidx], xdate[endidx]], [ycapital[startidx], ycapital[endidx]],
                s=80, c='g', marker='v', label='MaxDrawdown Duration')

    plt.xticks(rotation=15)
    # plt.yticks(color='gray')  # 设置刻度值颜色

    fontdict = {"family": "serif", 'size': 13}  # Times New Roman, Arial; 'color': 'gray'
    label_dict = {
        "title": "Random account value",
        "xlabel": "Date(daily)",
        "ylabel": "Account value",
    }

    set_lable(label_dict, fontdict, bold=True)
    set_spline(ax)  # 去掉边框
    set_xtick_cut(ax)  # 分成 10 份
    plt.tick_params(left='off')

    # 设置刻度的朝向,宽,长度
    plt.tick_params(which='major', direction='out', width=0.3, length=3)  # in, out or inout
    plt.grid(axis='y', color='lightgray', linestyle='-', linewidth=0.5)
    plt.legend(loc='best', frameon=False, ncol=1)
    plt.show()


def cal_drawdown(data, column='price'):
    """ Calculate drawdown"""
    data['returns'] = np.log(data[column] / data[column].shift(1))
    data['cumret'] = data['returns'].cumsum().apply(np.exp)
    data['cummax'] = data['cumret'].cummax()
    data['drawdown'] = data['cummax'] - data['cumret']
    return data


if __name__ == '__main__':
    xdate, ycapital = Init()

    df_stock = pd.DataFrame({'date': xdate, 'price': ycapital})
    df_stock = df_stock.set_index('date', drop=True)
    MaxDrawdown, end_idx, start_idx = cal_maxdrawdown(df_stock, ori_column='price', dd_column='returns')
    plot(xdate, ycapital, df_stock)

 浙公网安备 33010602011771号