LaTeX 常用语法
多子图设置
使用宏包subfigure
\begin{figure}[htb!]
\centering
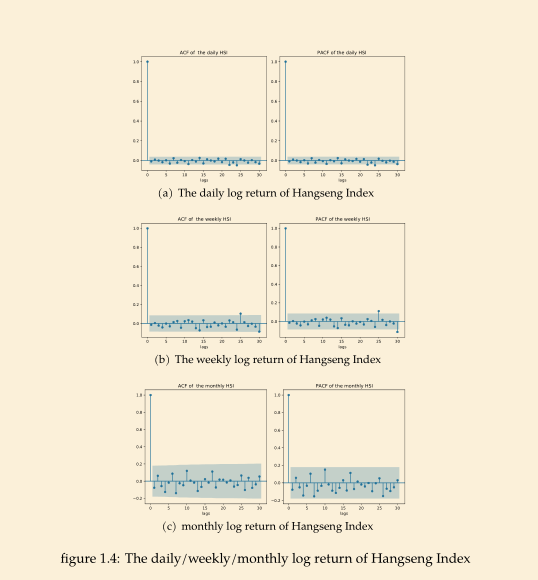
\subfigure[The daily log return of Hangseng Index ]{
\begin{minipage}[htb!]{\linewidth}
\centering
\includegraphics[width=0.45\linewidth]{the daily HSI _acf_pacf.pdf}
%\caption{fig2}
\end{minipage}%
}%
\subfigure[The weekly log return of Hangseng Index ]{
\begin{minipage}[htb!]{\linewidth}
\centering
\includegraphics[width=0.45\linewidth]{the weekly HSI_acf_pacf.pdf}
%\caption{fig2}
\end{minipage}
}%
\subfigure[monthly log return of Hangseng Index ]{
\begin{minipage}[htb!]{\linewidth}
\centering
\includegraphics[width=0.45\linewidth]{the monthly HSI_acf_pacf.pdf}
%\caption{fig2}
\end{minipage}
}%
\centering
\caption{The daily/weekly/monthly log return of Hangseng Index}
\end{figure}
\begin{figure}[ht!]
\centering
\includegraphics[scale = 0.4]{RV_acf_pacf.pdf}
\caption{realized volatility \{$RV_{t}$\}}
\end{figure}
code
\lstnewenvironment{python}[1][]{
\lstset{
showtabs=true,
tab=,
tabsize=2,
language=python,
basicstyle=\ttfamily\tiny\tiny\setstretch{1},
stringstyle=\color{orange},
showstringspaces=false,
alsoletter={1234567890},
otherkeywords={\ , \}, \{},
keywordstyle=\color{purple},
emph={access,and,break,class,continue,def,del,elif ,else,%
except,exec,finally,for,from,global,if,import,in,i s,%
lambda,not,or,pass,print,raise,return,try,while},
emphstyle=\color{purple}\bfseries,
emph={[2]True, False, None, self},
emphstyle=[2]\color{red},
emph={[3]from, import, as},
emphstyle=[3]\color{cyan},
upquote=true,
morecomment=[s]{"""}{"""},
commentstyle=\color{teal}\slshape,
emph={[4]1, 2, 3, 4, 5, 6, 7, 8, 9, 0},
emphstyle=[4]\color{cyan},
literate=*,
rulecolor=\color{black!40},
frame=tb,
backgroundcolor=\color{white},
breakindent=.5\textwidth,frame=single,breaklines=true%
}}{}
\begin{frame}[fragile]
  \frametitle{Example:Mnist}
  \begin{python}
### Using the SkLearn interface ###
from keras.datasets import mnist
from catboost import CatBoostClassifier,Pool
from sklearn.model_selection import GridSearchCV
from sklearn.metrics import accuracy_score
import numpy as np
(X,y),(X_test,y_test) = mnist.load_data()
# (60000,28,28)
print('x_shape:',X.shape)
# 60000
print('y_shape:',y.shape)
X = X.reshape(X.shape[0],-1)/255
X_test = X_test.reshape(X_test.shape[0],-1)/255

param_test = {'iterations':np.arange(10,51,20),'learning_rate':[0.1,0.2],
        'depth':np.arange(4,9,2)}

cat = CatBoostClassifier(eval_metric="AUC",one_hot_max_size=31,l2_leaf_reg= 9,silent=False)
grid_search = GridSearchCV(estimator=cat,param_grid=param_test,cv=2,verbose=2,n_jobs=-1)
grid_search.fit(X,y)
# grid_search.cv_results_  # Search for detailed results
grid_search.best_params_
grid_search.best_score_
cat = grid_search.best_estimator_  # Best model
y_pred = cat.predict(X_test)
accuracy = accuracy_score(y_pred,y_test)
print("The test set accuracy rate is:%.2f%%"%(accuracy*100.0))
\end{python}
The test set accuracy rate is: 96.9\%
其他
\section*{Notation}  %不带序号
\setlength{\parindent}{0pt} % 全局取消缩进
\renewcommand{\figurename}{Fig.} % figure name
table
- 表格制作:https://www.tablesgenerator.com/latex_tables
- 表格内手动换行:https://blog.csdn.net/weixin_41938903/article/details/109788918
- 表格内自动换行:https://blog.csdn.net/robertchenguangzhi/article/details/48916319
- 表格内行距:https://blog.csdn.net/yihaizhiyan/article/details/37909711
- 表格caption字体设置:https://blog.csdn.net/weixin_43849277/article/details/115249293
目录
参考文献
Beamer
\usepackage{apacite}
\usepackage{natbib}
- item 间距设置:https://cxymm.net/article/fandroid/54644966
- 生成空白页:codeleading.com/article/78753540563/
- bemaer 页面内跳转:https://tex.stackexchange.com/questions/269577/beamer-hyperlink-to-specific-slide-in-frame
\hyperlink{label}{\beamerbutton{I jump to fourth slide of next frame}}
\hypertarget{label}{ }
- animate 宏包教程:https://www.latexstudio.net/archives/10566.html; 只有几个阅读器可以打开
图片路径
\usepackage{graphicx} % Allows including images
\graphicspath{{figs/}}
Beamer
% 16:9 设置
\documentclass[aspectratio=169]{beamer}
% thanks
\usepackage{calligra} % thanks pakeage
% ------
\begin{frame}[plain]

\begin{center}
{\Huge\calligra Thanks!}
\end{center}
\end{frame}
% 消除导航框
\setbeamertemplate{navigation symbols}{}
article
\renewcommand \refname{Reference} # 改成 Reference
\renewcommand{\baselinestretch}{1.15} # 行间距
\usepackage{appendix}
  \begin{appendices}
      \section{aa  }
      some text in Appendix A
      \section{bb  }
      some text in Appendix B
  \end{appendices}
algorithm2e
排版样例 算法
\usepackage[linesnumbered, ruled, vlined]{algorithm2e}
\SetKwInput{KwIn}{Input}
\SetKwInput{KwOut}{Output}
\setcounter{algocf}{0}
% \LinesNumberedHidden % hidden the number
\LinesNotNumbered % using the continue numberl 1,2,3
\SetAlgoNoLine
% \SetAlgoLongEnd
\SetAlCapHSkip{0.5em}
\setlength{\algomargin}{1em}
% \SetNlSkip{-0cm}
\SetAlgoNoEnd
\SetNlSty{}{}{: }
% -------------------------------------
\begin{algorithm}[H]
\DontPrintSemicolon
\scriptsize
\nl \KwIn{ Hypyerparamter; y (Observations)}
\nl Step 1: Specify the set of models under consideration \;
\nl \While{ $ j<T $ }{
		\nl 设置 $ P^t = \frac{w^t}{\sum\limits_{i=1}^{N} w_i^t} $ \;
		\nl 依据概率 $ P^t $ 调用弱学习机 WL\;
		\nl 返回假设值 $ h_t: X \mapsto [0, 1] $ \;
		\nl 计算第 $ h_t $ 的损失: $ \varepsilon_t = \sum\limits_{i=1}^{N} P_i^t |h_t(x_i) - y_i| $ \;
		\nl 使得 $ \beta_t = \varepsilon_t/ (1-\varepsilon_t) $ \;
		\nl 使得 $ \alpha_t = \frac{1}{2}\lg \beta_t $ \;
		\nl 更新权重分布\;
		$ D_{t+1} = (w_1^{t+1}, \cdots, w_i^{t+1}), \cdots, w_N^{t+1} $ \;
		$ w_i^{t+1} = w_i^t \beta^{1-|h_t(x_i)- y_i|}, i = 1, 2, \cdots, N $ \;
		\nl 计算最终假设\;
		$ h(f) = \text{sign} \{ \sum\limits_{i=1}^{T} \alpha_t \text{WL}_t(x)\} $ \;
		\nl \endEnd{End} }
\caption{MCMC}
\end{algorithm}
自定义
# ref: https://blog.csdn.net/th_num/article/details/53032688
\usepackage{amsthm}
\newtheorem{myDef}{Definition}
\newtheorem{myTheo}{Theorem}
# ref: https://blog.csdn.net/weixin_42845306/article/details/124652562
\numberwithin{myDef}{section}%图表按章节编号
表头原点
\useoutertheme[footline=authortitle,subsection=false]{miniframes}
\useinnertheme{rounded}
\addtobeamertemplate{block begin}{}{\justifying}
\newtheorem{remark}[theorem]{Remark}
\renewcommand{\indent}{\hspace*{2em}}
\setbeamertemplate{theorems}[numbered]
\setbeamertemplate{caption}[numbered]
\usepackage[justification=centering]{caption}
\renewcommand{\qedsymbol}{$\blacksquare$}
图片背景
\usebackgroundtemplate{%
	\tikz[overlay,remember picture] \node[opacity=0.02, at=(current page.center)] {
		\includegraphics[height=4.5in,width=4.5in]{./Figures/WMSU LOGO.png}};
asmath
% https://tex.stackexchange.com/questions/613824/how-can-i-write-iid-in-an-equation-in-normal-letters
\overset{\mathrm{iid}}{\sim}

% 加粗, 改成h命令
\newcommand{\h}[1]{\boldsymbol{#1}}
table
Latex表格设置问题, 将Excel表格转换为Latex格式表格
\setlength\tabcolsep{3pt}

 浙公网安备 33010602011771号